Kartoza - GIS in the classroom - Exploring the SAGTA Map Downloader
GIS is part of the school Geography curriculum in South Africa. Teachers need to grasp GIS concepts and teach them in the classroom. Geography teachers and students often need access to topographical
Overview
The FOSS4G conference was in full swing in 2022 after a hiatus due to Covid 19. The conference allows users from accross the globe to meet and share as per the philosophy of FOSS (Free and Open Source Software). I was quite privileged to present the work I have been doing with Geography Teachers in southern Africa.
SAGTA (the Southern African Geography Teachers Association) is a network for professional growth of Geography teachers in southern Africa. Geography teachers are at the core of the SAGTA Map Downloader tool that Kartoza has been developing and maintaing since early 2020. The Map Downloader allows teachers or students to do the following:
- Download topographic or orthophoto maps that emulate official South African 1:50000 topographical maps or 1:10000 orthophoto maps
- Download 'hybrid' style maps that are a composite of topographic and orthophoto layers
- Annotate maps and print various layouts
- Include optional elements in the the online view and printed versions of the maps
Software Stack
The SAGTA MapDownloader is powered by Lizmap Webclient. Other software in the stack includes: * PostgreSQL * PostGIS * GeoServer * MapProxy * QGIS Desktop * QGIS Server
Deployed software Stack
Key Features of the tool
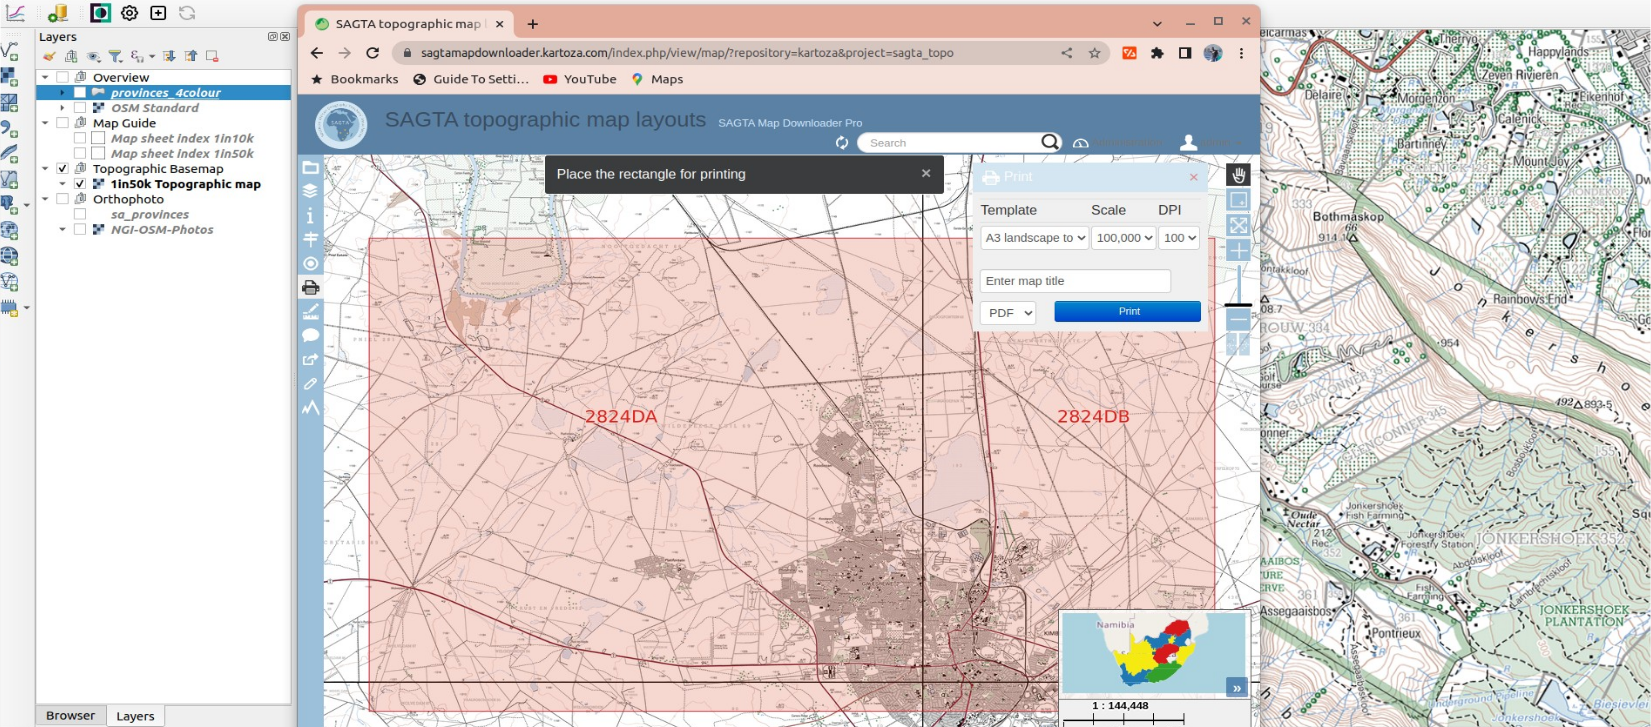
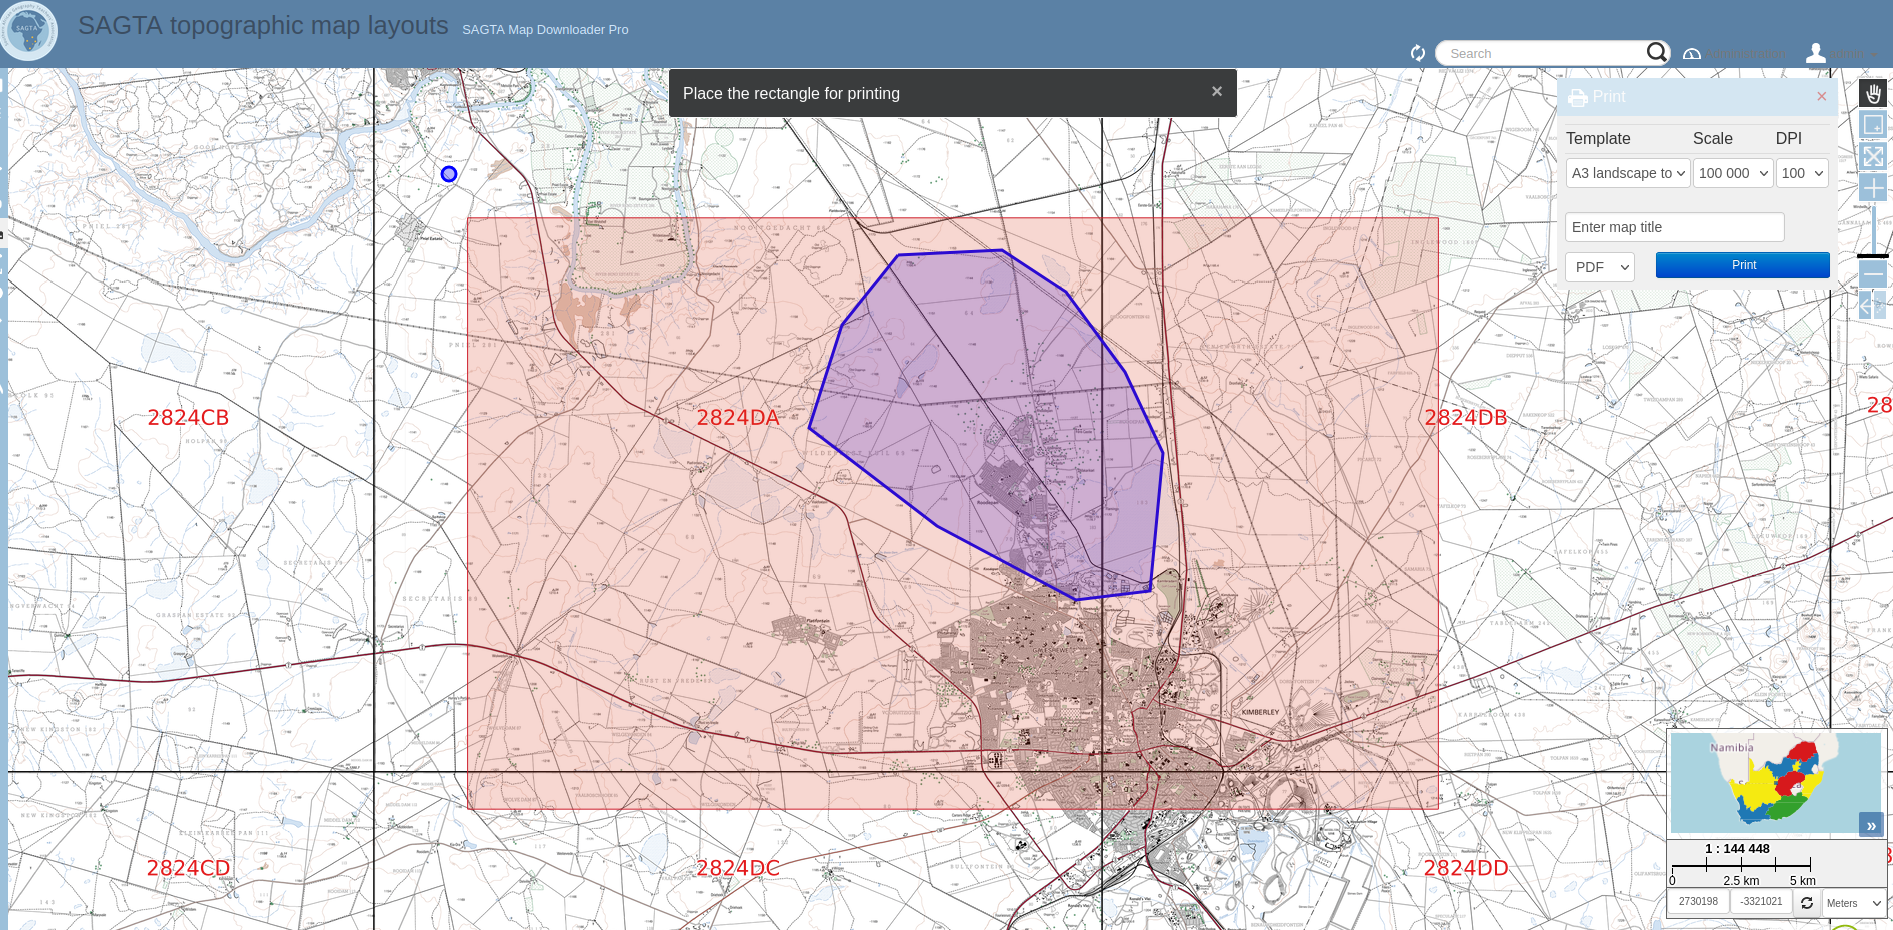
Print AOI (area of interest) on the various map layouts
A user can choose a custom area on the map and print to pdf or various image types.
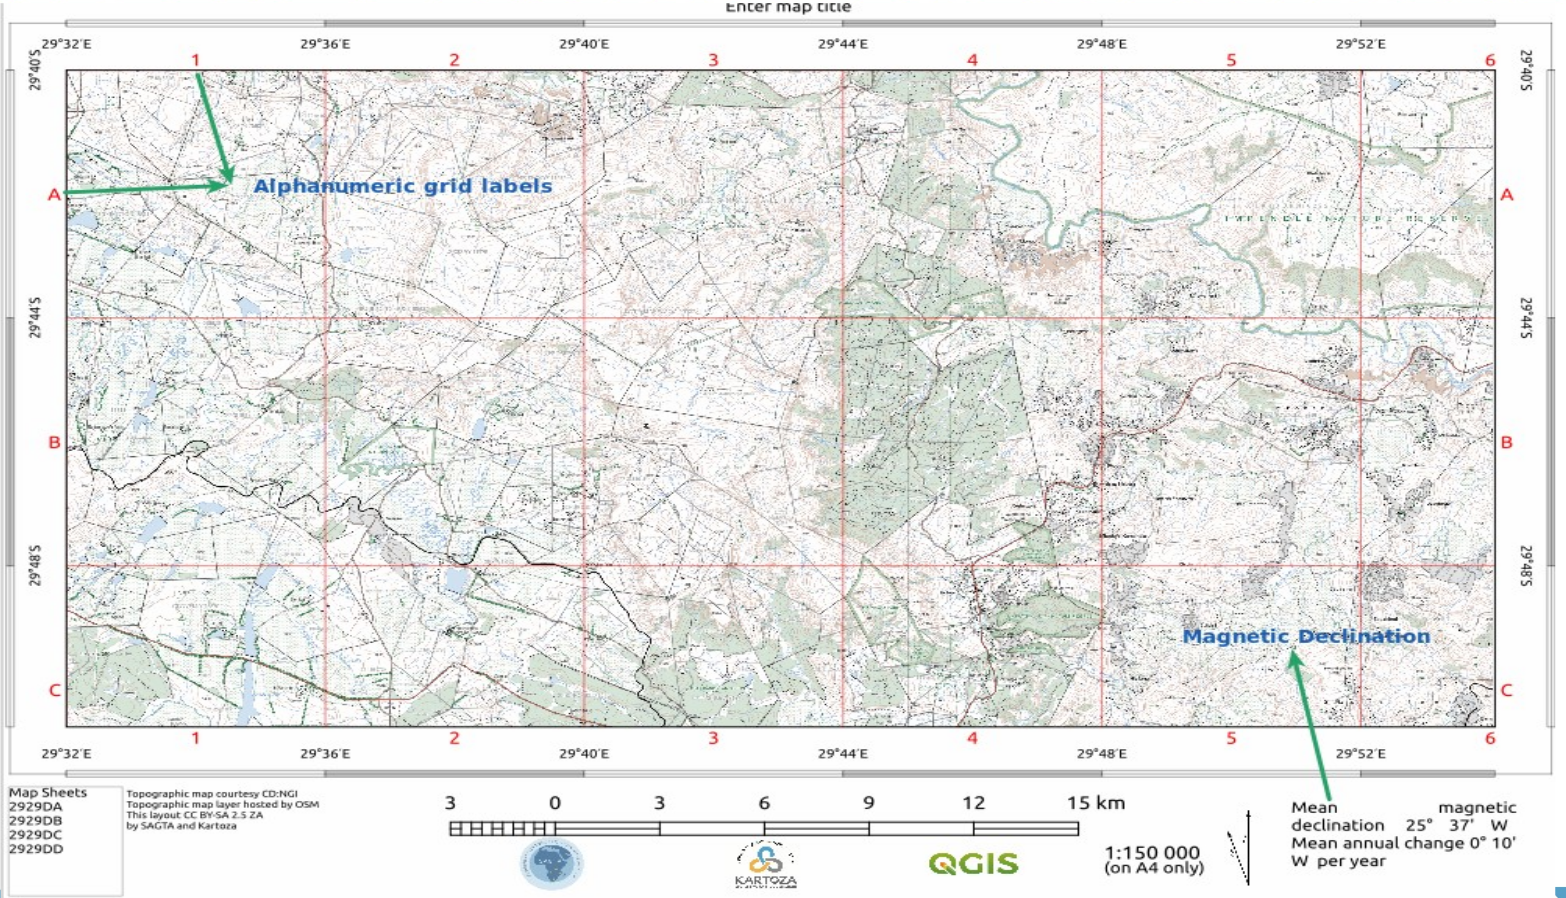
Print layouts with magnetic declination and custom grids
This is available on the topographic map layout. The topographic layouts depict the 1:50000 topographic maps provided by the national mapping agency, NGI. These mainly depict the natural and man made features by means of symbols and colour, with elevation represented by spot-heights and contours. The magnetic declination is calculated dynamically using logic from the NOAA online tool, which is wrapped into a QGIS Server Python plugin. The custom grids are also calculated by a QGIS Server plugin as this functionality is not natively available in QGIS.
Elevation profile
This allows users to draw a line on the map along which they would like to see a cross-section. A cross-section, or profile, is calculated with the corresponding values being shown in a plot. This feature mainly uses lizmap-altiProfil, which interpolates a digital elevation model stored in the PostgreSQL database to get the values along the section chosen by the user.
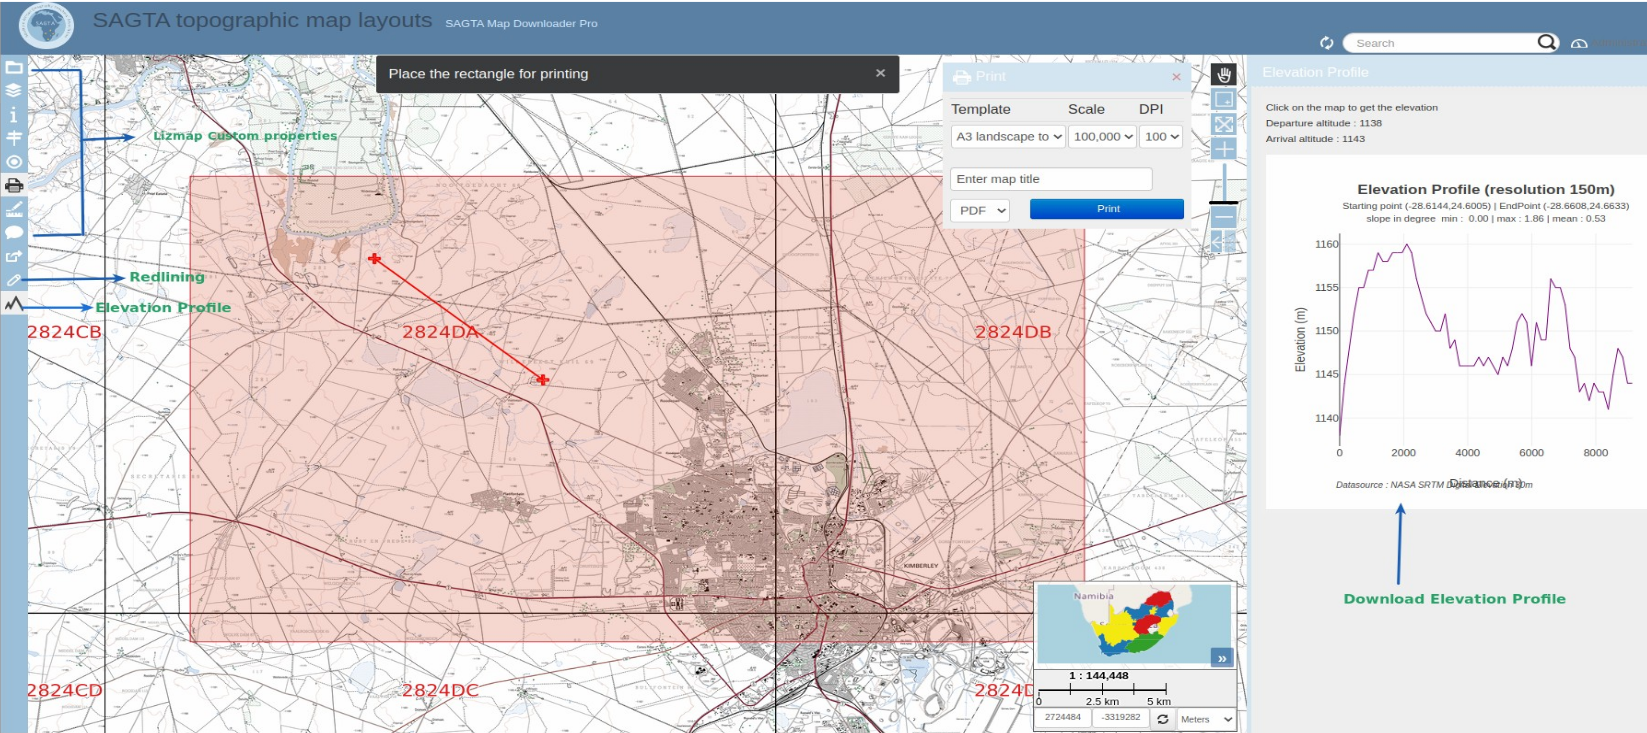
Redlining
User can choose to draw custom shapes to annotate a specific area of interest. These will be visible on the printed map layouts.
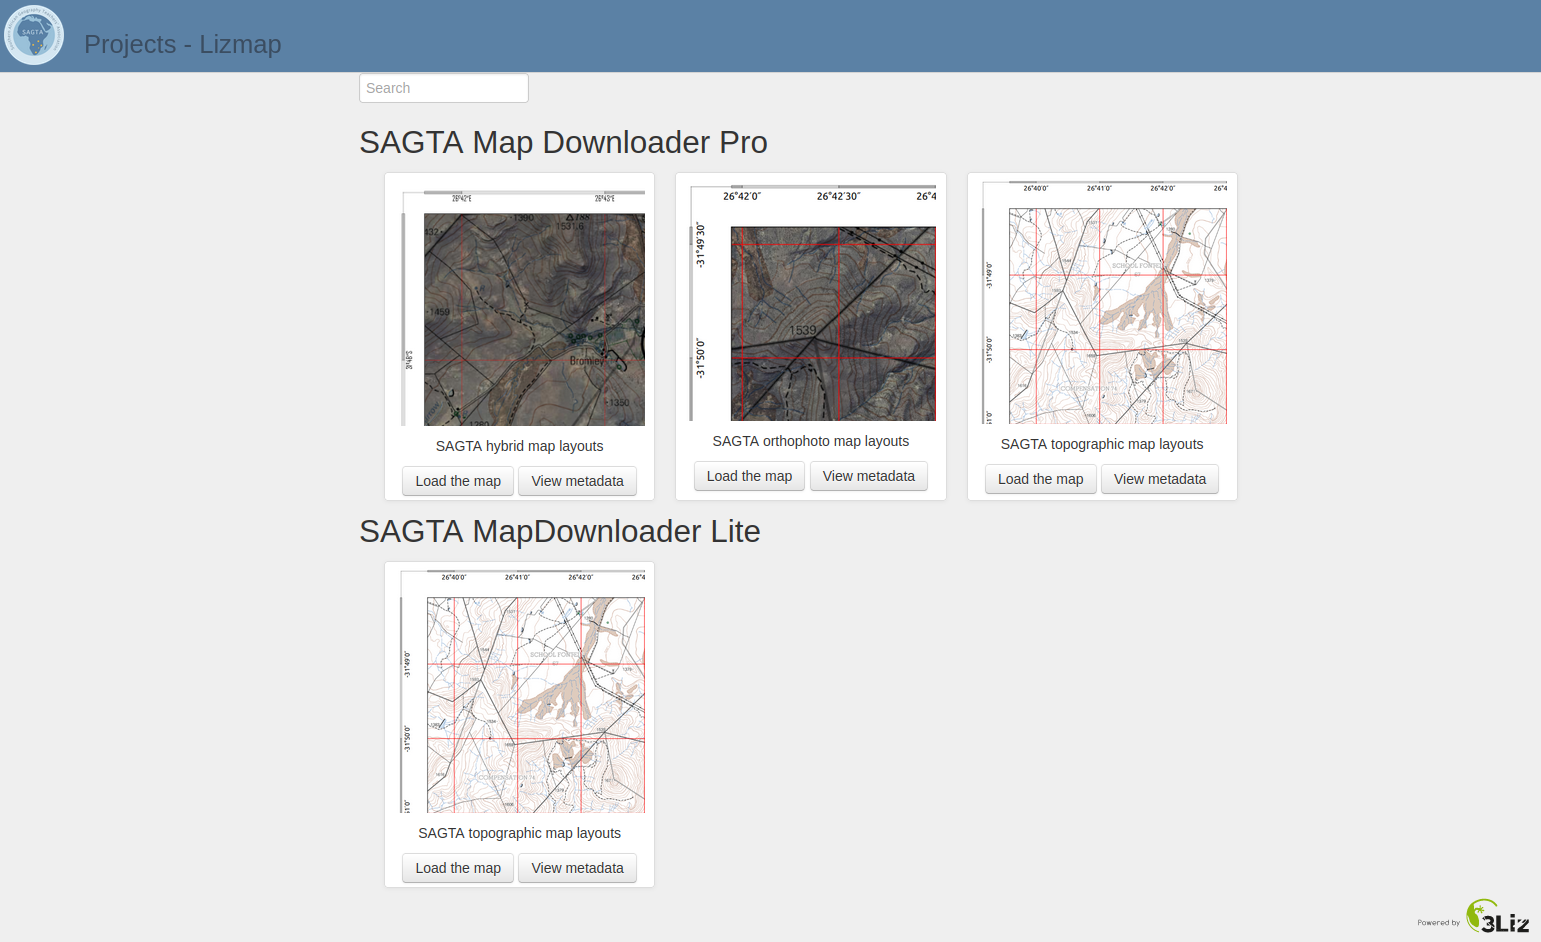
Map Layouts
There are three main options available for users to explore * Topographic map * Orthophoto map * Hybrid map (consists of blended (composite) orthophoto and topographic map)
The public Lite version has only the topographic maps with limited features. To access the other maps and all features you need to be a member of SAGTA.
The map downloader has gone a long way to assist geography teachers in setting Geography assessments and for general classroom or homework use. The usage of the tool has been very high and it is continually evolving as new features from the software stacks become available or as new feature requests come in from users.


No comments yet. Login to start a new discussion Start a new discussion