Kartoza
  • About
      Partners Careers About Kartoza Team
  • Shop
      GeoSpatialHosting Courses
  • Gallery
      Portfolio Maps Apps
  • Blog
  • Solutions
  • Contact
  • Login
Kartoza Web Mapping Gallery

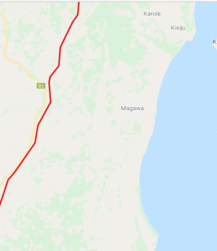
Vector Tiles Rendering from PostgreSQL

kartoza web mapping gallery

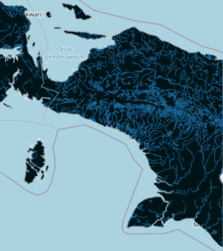
This map renders vector tiles from a PostgreSQL database using Martin. The vector tiles are served using OpenLayers V6 and the styling is done on the client. To populate the database we are using Docker OSM. Docker OSM periodically fetches updates from the OSM API to maintain up to date data.

View Map

Swellendam

kartoza web mapping gallery

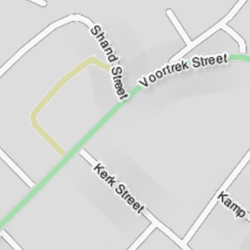
This map shows how you can use QGIS to publish your own custom maps based on OpenStreetMap data. The roads and building data was downloaded using our OSM Reporter tool which provides ready to use .qml styles along with the extracted data. Additional context data is provided using data from the South African Chief Directorate of National Geo-Spatial Information.

View Map

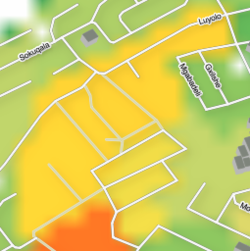
Kartoza FBIS Basemap

kartoza web mapping gallery
This map shows a basemap for South Africa with major emphasis on rivers and the map switches to the TopoStyle basemap when zoomed beyond 80K.
View Map

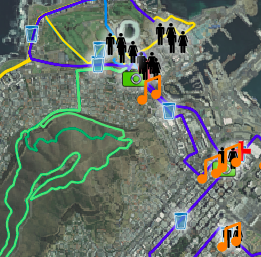
Flood Forecasting Planning

kartoza web mapping gallery

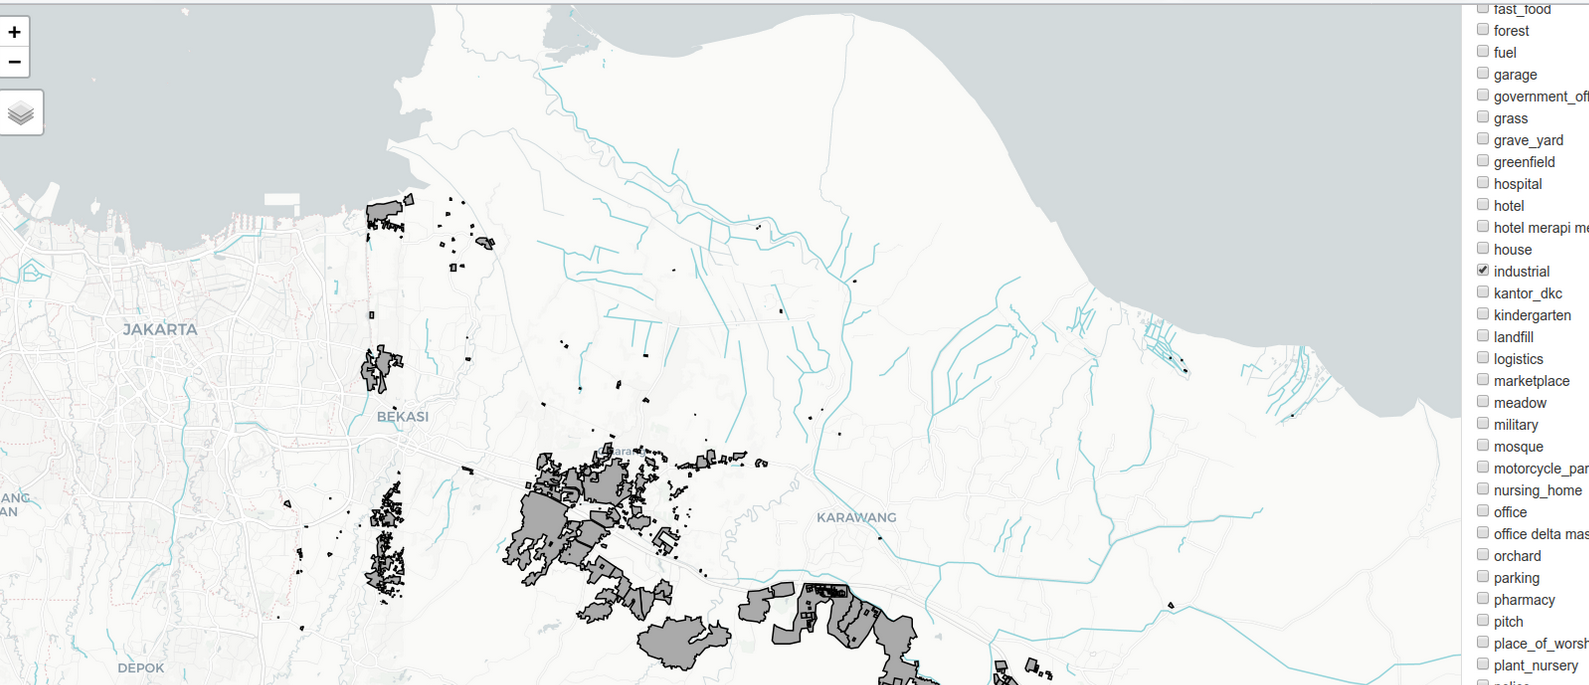
This map shows flood vulnerability indicators extracted from Open Street Map. The data shown on this map is extracted from OSM using Docker OSM. The leaflet webmap renderes GeoServer layers using CQL filters. Some the the data is rendered on the client from postgres.

View Map

Cathkin Conservancy

kartoza web mapping gallery
This is a map of the Cathkin Conservancy near the Drakensberg Mountains, in KwaZulu-Natal. The project intends to understand the distribution of farms, natural features and man-made features. The map was created in QGIS with unique styles overlayed with a topo-style basemap.
View Map

Cape Town Marathon

kartoza web mapping gallery

Based on data from (c) SA-NGI. The first version of this map showed the 2017 Cape Town Marathon and related routes. It was recently updated to show the 2018 routes and is updated live by the marathon planners.

View Map

MapServer Demo

kartoza web mapping gallery
This map shows the capabilities of MapServer in serving dynamic data from a remote PostGIS database. A user edits the road layer in a Desktop GIS and the buffer dynamically gets updated in the viewer.
View Map

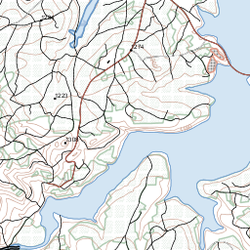
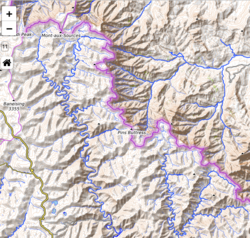
NGI 1:50 000 topographical map

kartoza web mapping gallery

Based on data from (c) SA-NGI. This map shows data that has been styled in QGIS to resemble the 1:50 000 topographical map sheets that are produced by the South African Chief Directorate of National Geo-Spatial Information(NGI). NGI provides raster formats for the 1:50 000 topographic map series.

View Map

Cape Winelands District

kartoza web mapping gallery

Based on data from OpenStreetMap and population data published by CIESIN with district boundary provided by The South African Demarcation Board, this is a simple local map of the Cape Winelands area.

View Map

Boosmansbos

kartoza web mapping gallery
This is a hiking trail map for Boosmansbos Wilderness Area, near Heidelberg in the Western Cape Province of South Africa. The track shown is the recorded track from a Kartoza teambuilding hike we carried out in August, 2014.

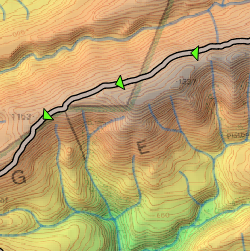
The digital elevation model was created by extracting nodes from the national 1:50 000 countour lines and then using the QGIS interpolation tool to create a DEM - which was subsequently converted to a hillshade model.
View Map
About Kartoza
We are a Free and Open Source GIS service provider with registered offices in South Africa and Portugal. We develop and maintain geographic information systems and train teams to use geospatial software to its full potential.
Navigate
  • Crowdfunding
  • Contact
  • Internships
  • Policies
  • We're Hiring!
  • Portfolio
  • Follow Kartoza


    Be the first to know! Sign up for our newsletter and stay in the loop with all things Kartoza.

    Cookie Consent

    This website uses cookies to ensure you get the best experience.