Kartoza - Creating a Live, Topic Specific Mirror of OpenStreetMap in PostGIS
Introduction In this article, we will do a walk-through of creating a live mirror of OSM for a specific country or region and for a specific set of OSM features. For this example, we will
Introduction
In this article, we will do a walk-through of creating a live mirror of OSM for a specific country or region and for a specific set of OSM features. For this example, we will fetch all building data for Angola into a PostGIS database, and update that database with new features as they arrive in OSM. Providing an OSM mirror in this way is a powerful tool to pair the power of OSM with the power of QGIS and PostGIS. Now you will be able to do offline analysis of the data in OSM. How does this all work? Here is a little diagram that illustrates the underlying architecture (click for a larger version):
Note that all the code for docker-osm, osm-enrich etc. is available in our GitHub repository: https://github.com/kartoza/docker-osm
So let's build a mirror of OSM buildings in Angola!
Overview of the steps we will follow
1) Identify the country / region .pbf file you will use.
2) Optionally create a clip.shp file for your area of interest
3) Optionally create a mappings.yml file
4) Modify the sample project, updating it with your options from 1-3 above.
4) Start the docker-compose project
5) Connect to the PostGIS database from QGIS
6) Using dbmanager to run arbitrary queries against your PostGIS database and create a view
7) Use time manager in QGIS to animate the data in your OSM mirror
Prerequisites
In this article, we assume you are already familiar with and have set up and installed (where applicable):
1) docker and docker-compose
2) GNU make
3) editing YAML files
4) basic OSM data and terminology
5) basic PostGIS usage (including connecting from QGIS, using dbmanager)
6) using QGIS and the time manager plugin in QGIS
Quickstart - Angola Buildings
Let's do a quickstart to demonstrate the system working and then we can follow on with an example where you create your own custom mirror.
Start by downloading our docker-osm-examples from here.
Now unzip the archive and cd into the 'angola-buildings' folder:
cd docker-osm-examples/angola-buildings
Next, we need to build the settings container and deploy everything:
make deploy
Assuming the deploy step runs without errors, you should see a few docker containers running:
------------------------------------------------------------------
Bringing up docker osm instance
------------------------------------------------------------------
Creating network "angola-buildings-osm-mirror_default" with the default driver
Creating volume "angola-buildings-osm-mirror_osm-postgis-data" with default driver
Creating volume "angola-buildings-osm-mirror_import_done" with default driver
Creating volume "angola-buildings-osm-mirror_import_queue" with default driver
Creating volume "angola-buildings-osm-mirror_cache" with default driver
Creating dockerosm_db ... done
Creating dockerosm_osmupdate ... done
Creating dockerosm_osmenrich ... done
Creating dockerosm_imposm    ... done
Once the docker containers start running, the PostGIS database will be initialised, the country.pbf file imported using imposm and then osm-enrich will start running to update the username and timestamp for each feature. You can track its progress like this:
docker logs -f dockerosm_osmenrich
Which should show the update stream from OSMENRICH:
Update for 381148400
Update for 381148402
Update for 381148404
Update for 381148406
Update for 381148408
Update for 381148410
After waiting a minute or two you should be able to establish a connection to the database from QGIS:
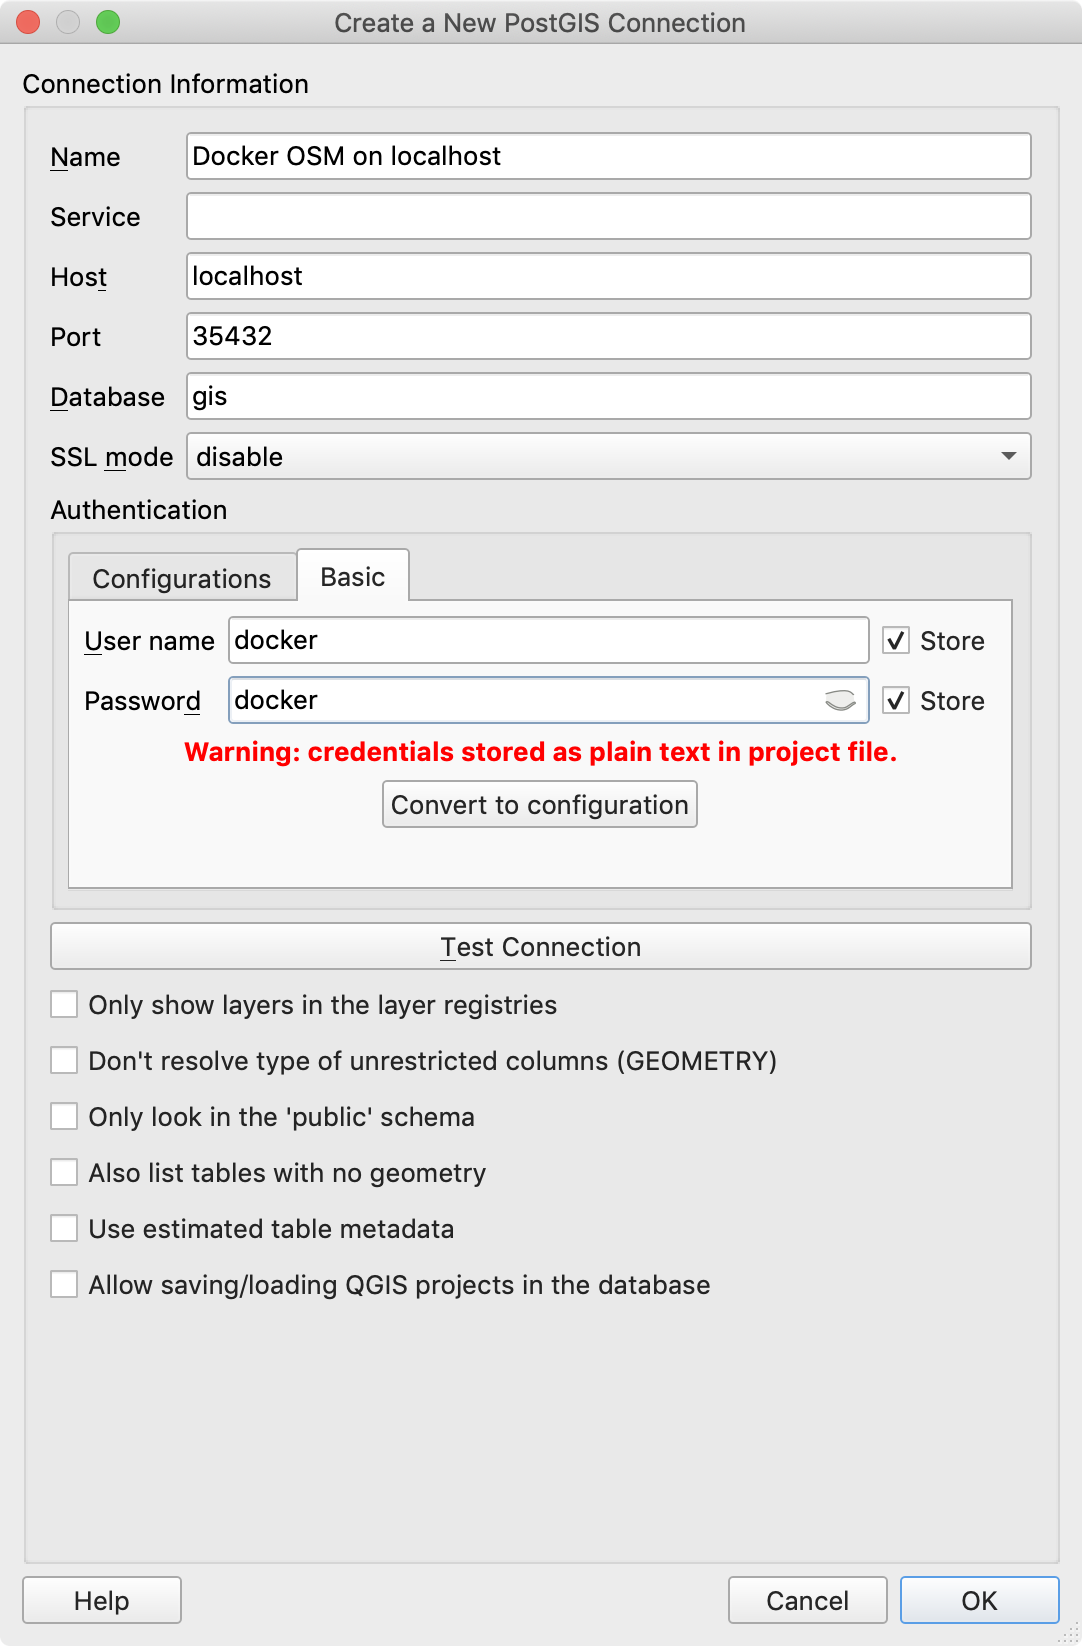
From where you can then drag and drop your OSM mirror layers into your project:
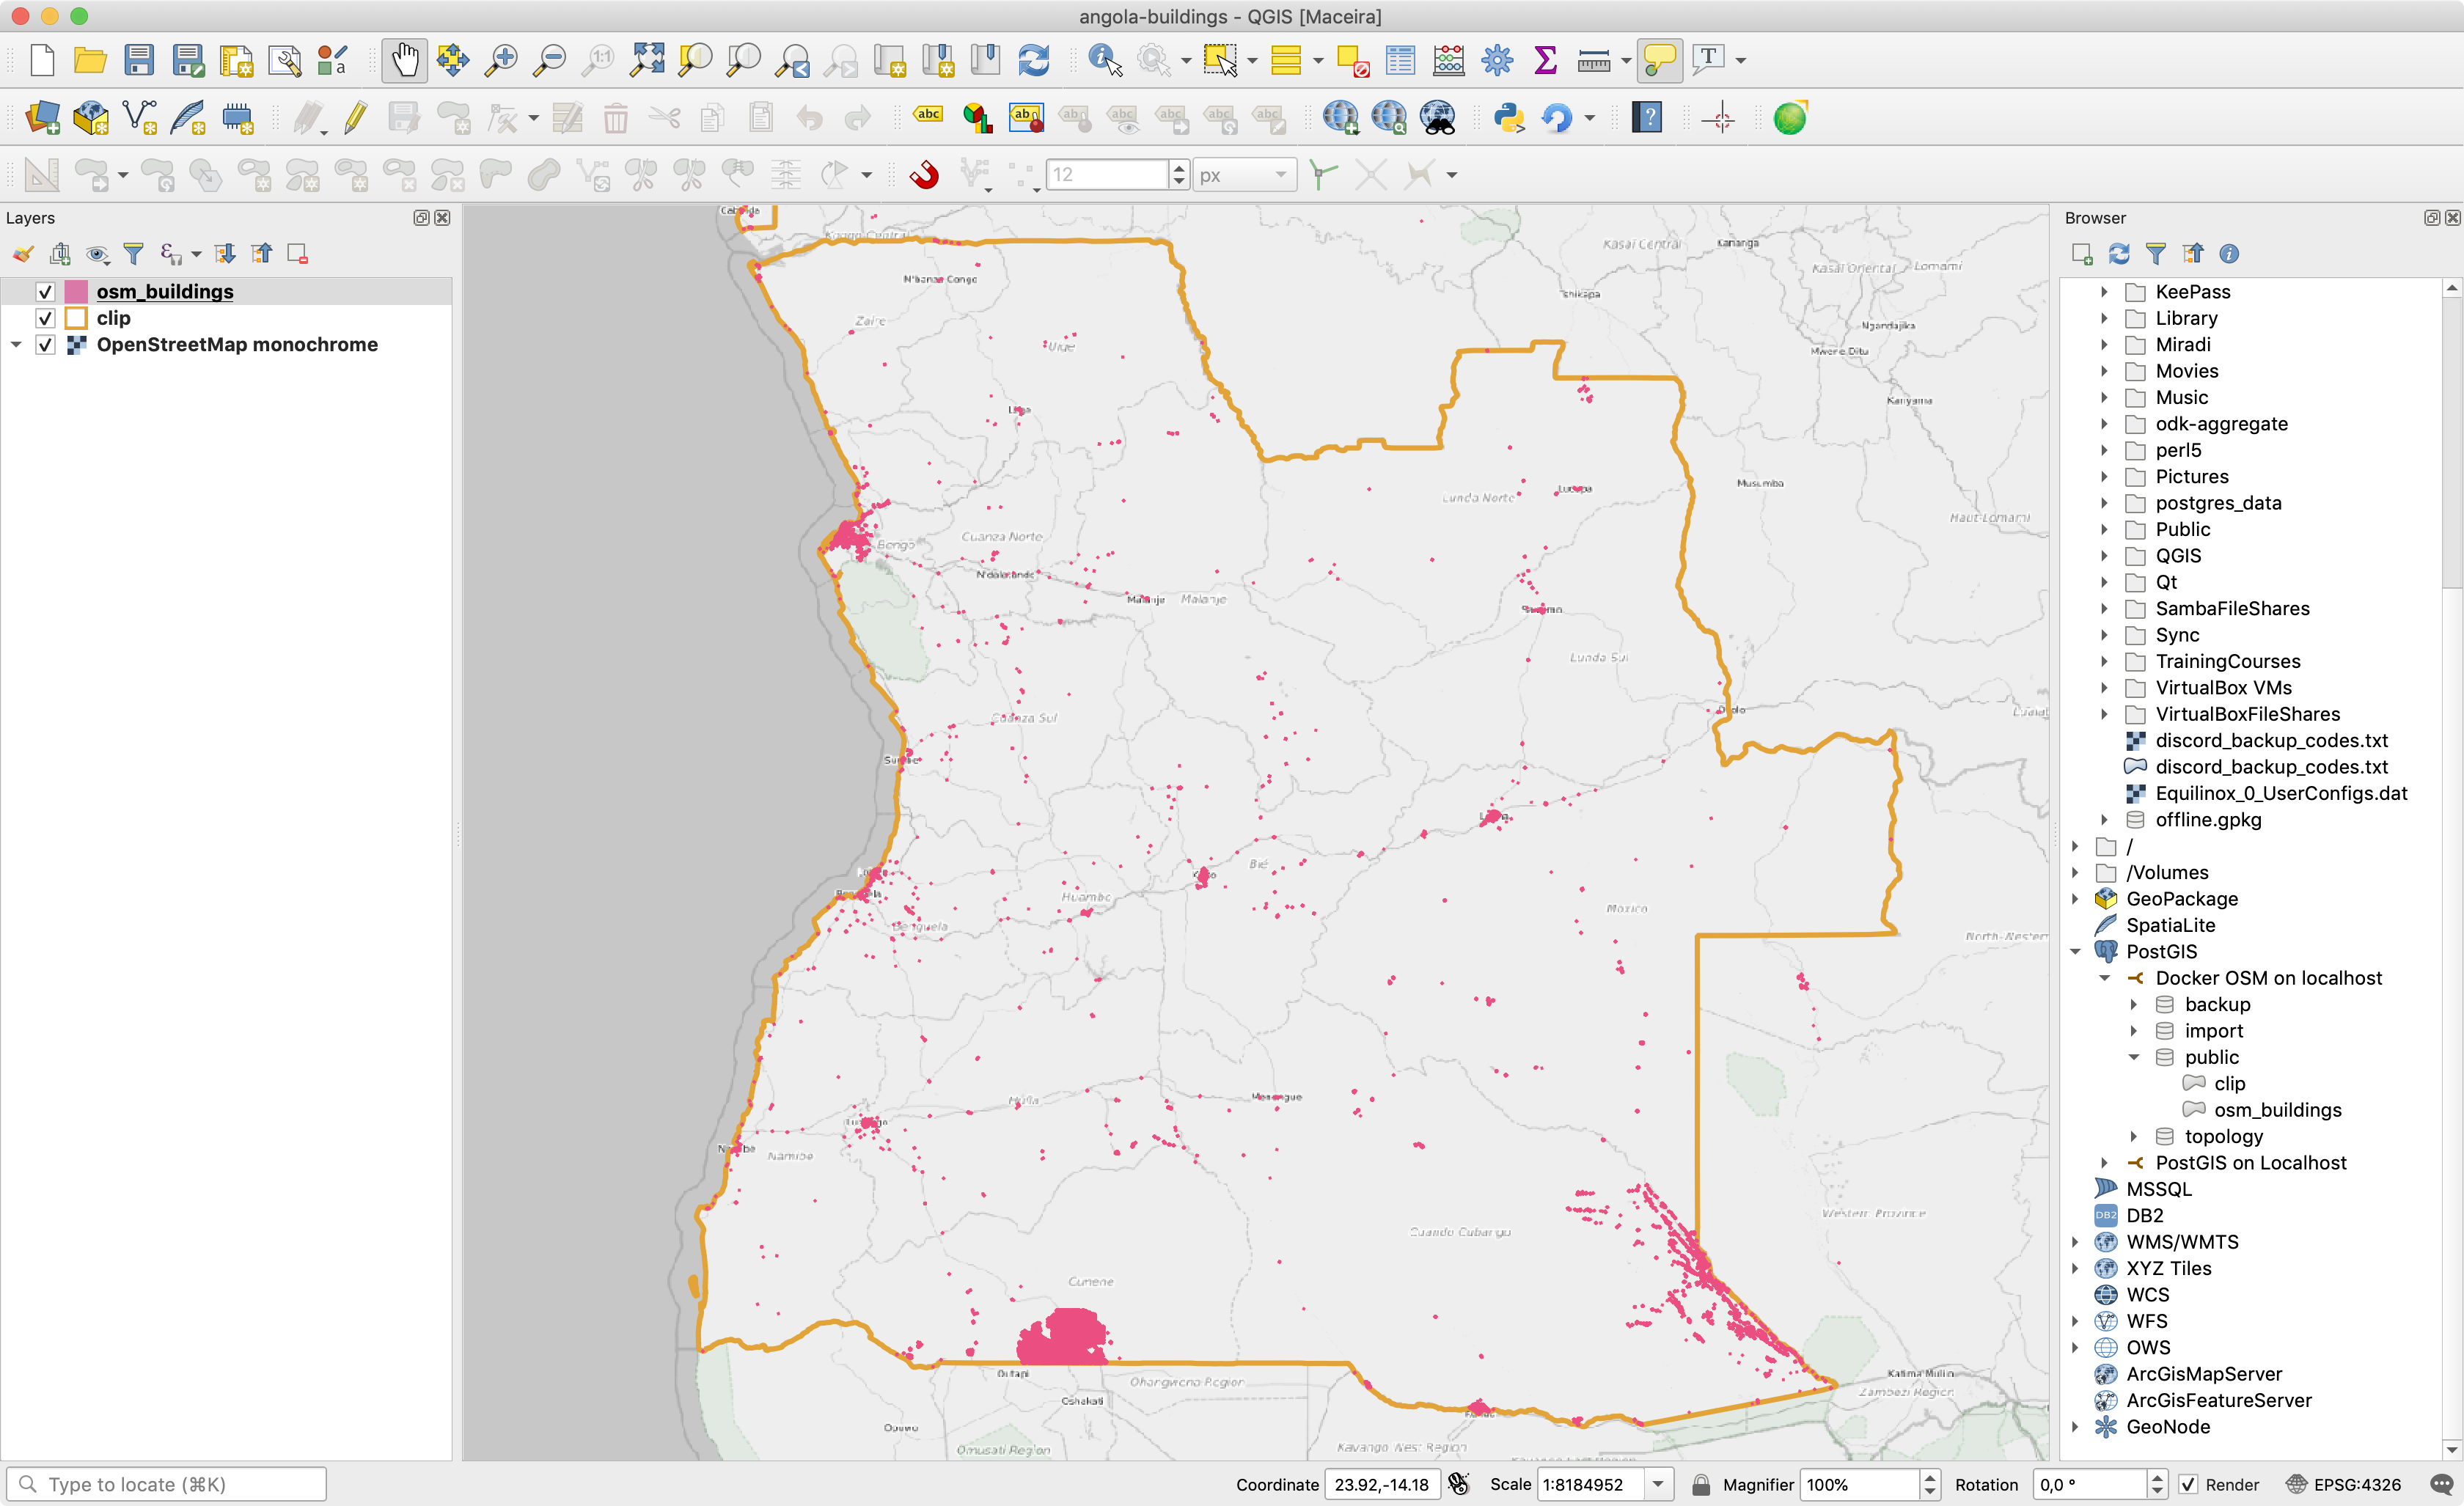
Depending on the size of your clip area / country area, the OSMENRICH process will take some time to run. Be kind to the OSM servers and don't use a larger clip area than you need as the OSMENRICH process will put some pressure on the OSM servers if you are running it from scratch too often. Once your mirror is initially updated from OSMENRICH, all of your records will have a user name and date associated. You can see the current status of OSMENRICH with this simple query in QGIS' dbmanager tool:
select
  count(*) as total,
  (select count(*) from osm_buildings where changeset_user is null) as to_update
  from osm_buildings;
Which will tell you the total number of records in total and the number of records still due to be updated via OSMENRICH.
Making a time series visualisation
Now that you have the mirror running, it is possible to use QGIS to do desktop based analysis and visualisation on OSM data. In this example, we will create a view first that shows only records that have been updated by OSMENRICH and then use that view as the basis for our time manager layer. We do this because timemanager does not like it when we have a table with partially populated timestamps. Here is the SQL for the OSMENRICH populated view:
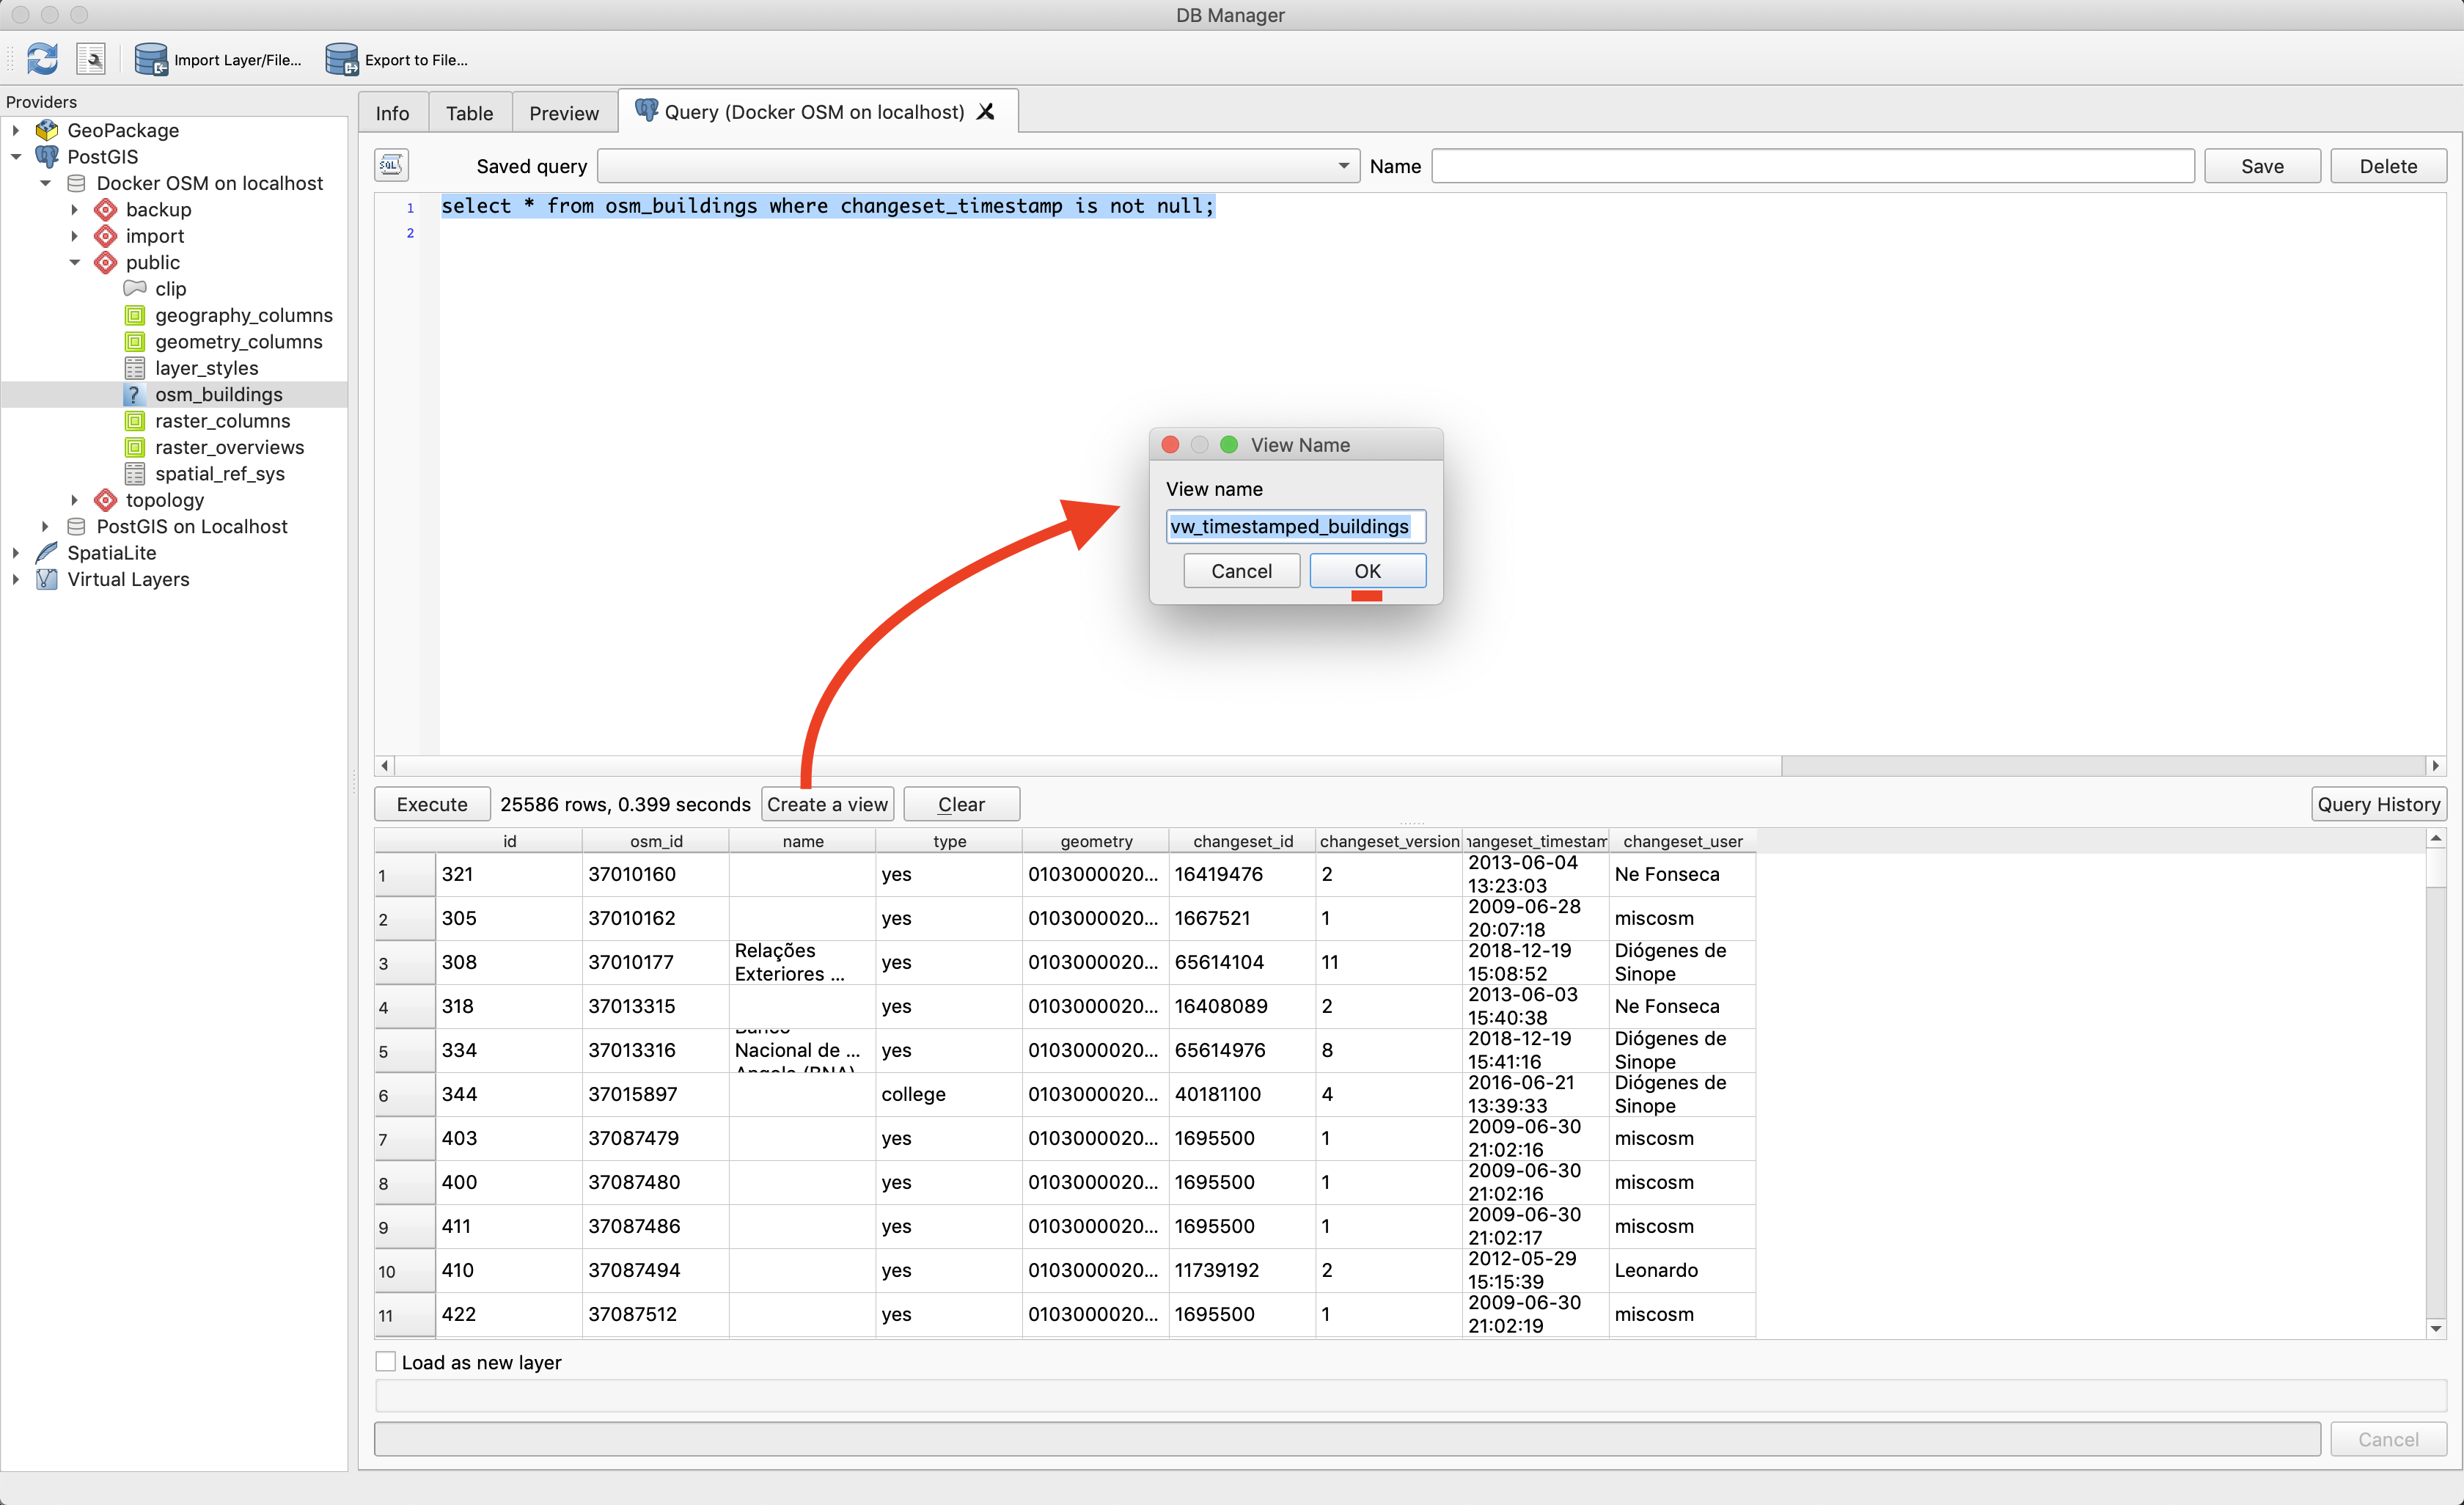
SELECT *
FROM osm_buildings
WHERE (osm_buildings.changeset_timestamp IS NOT NULL);
Test the query and then create a view from it, either by using a CREATE VIEW sql statement or by using the feature in QGIS' dbmanager that lets you quickly turn any query into a view as shown below.
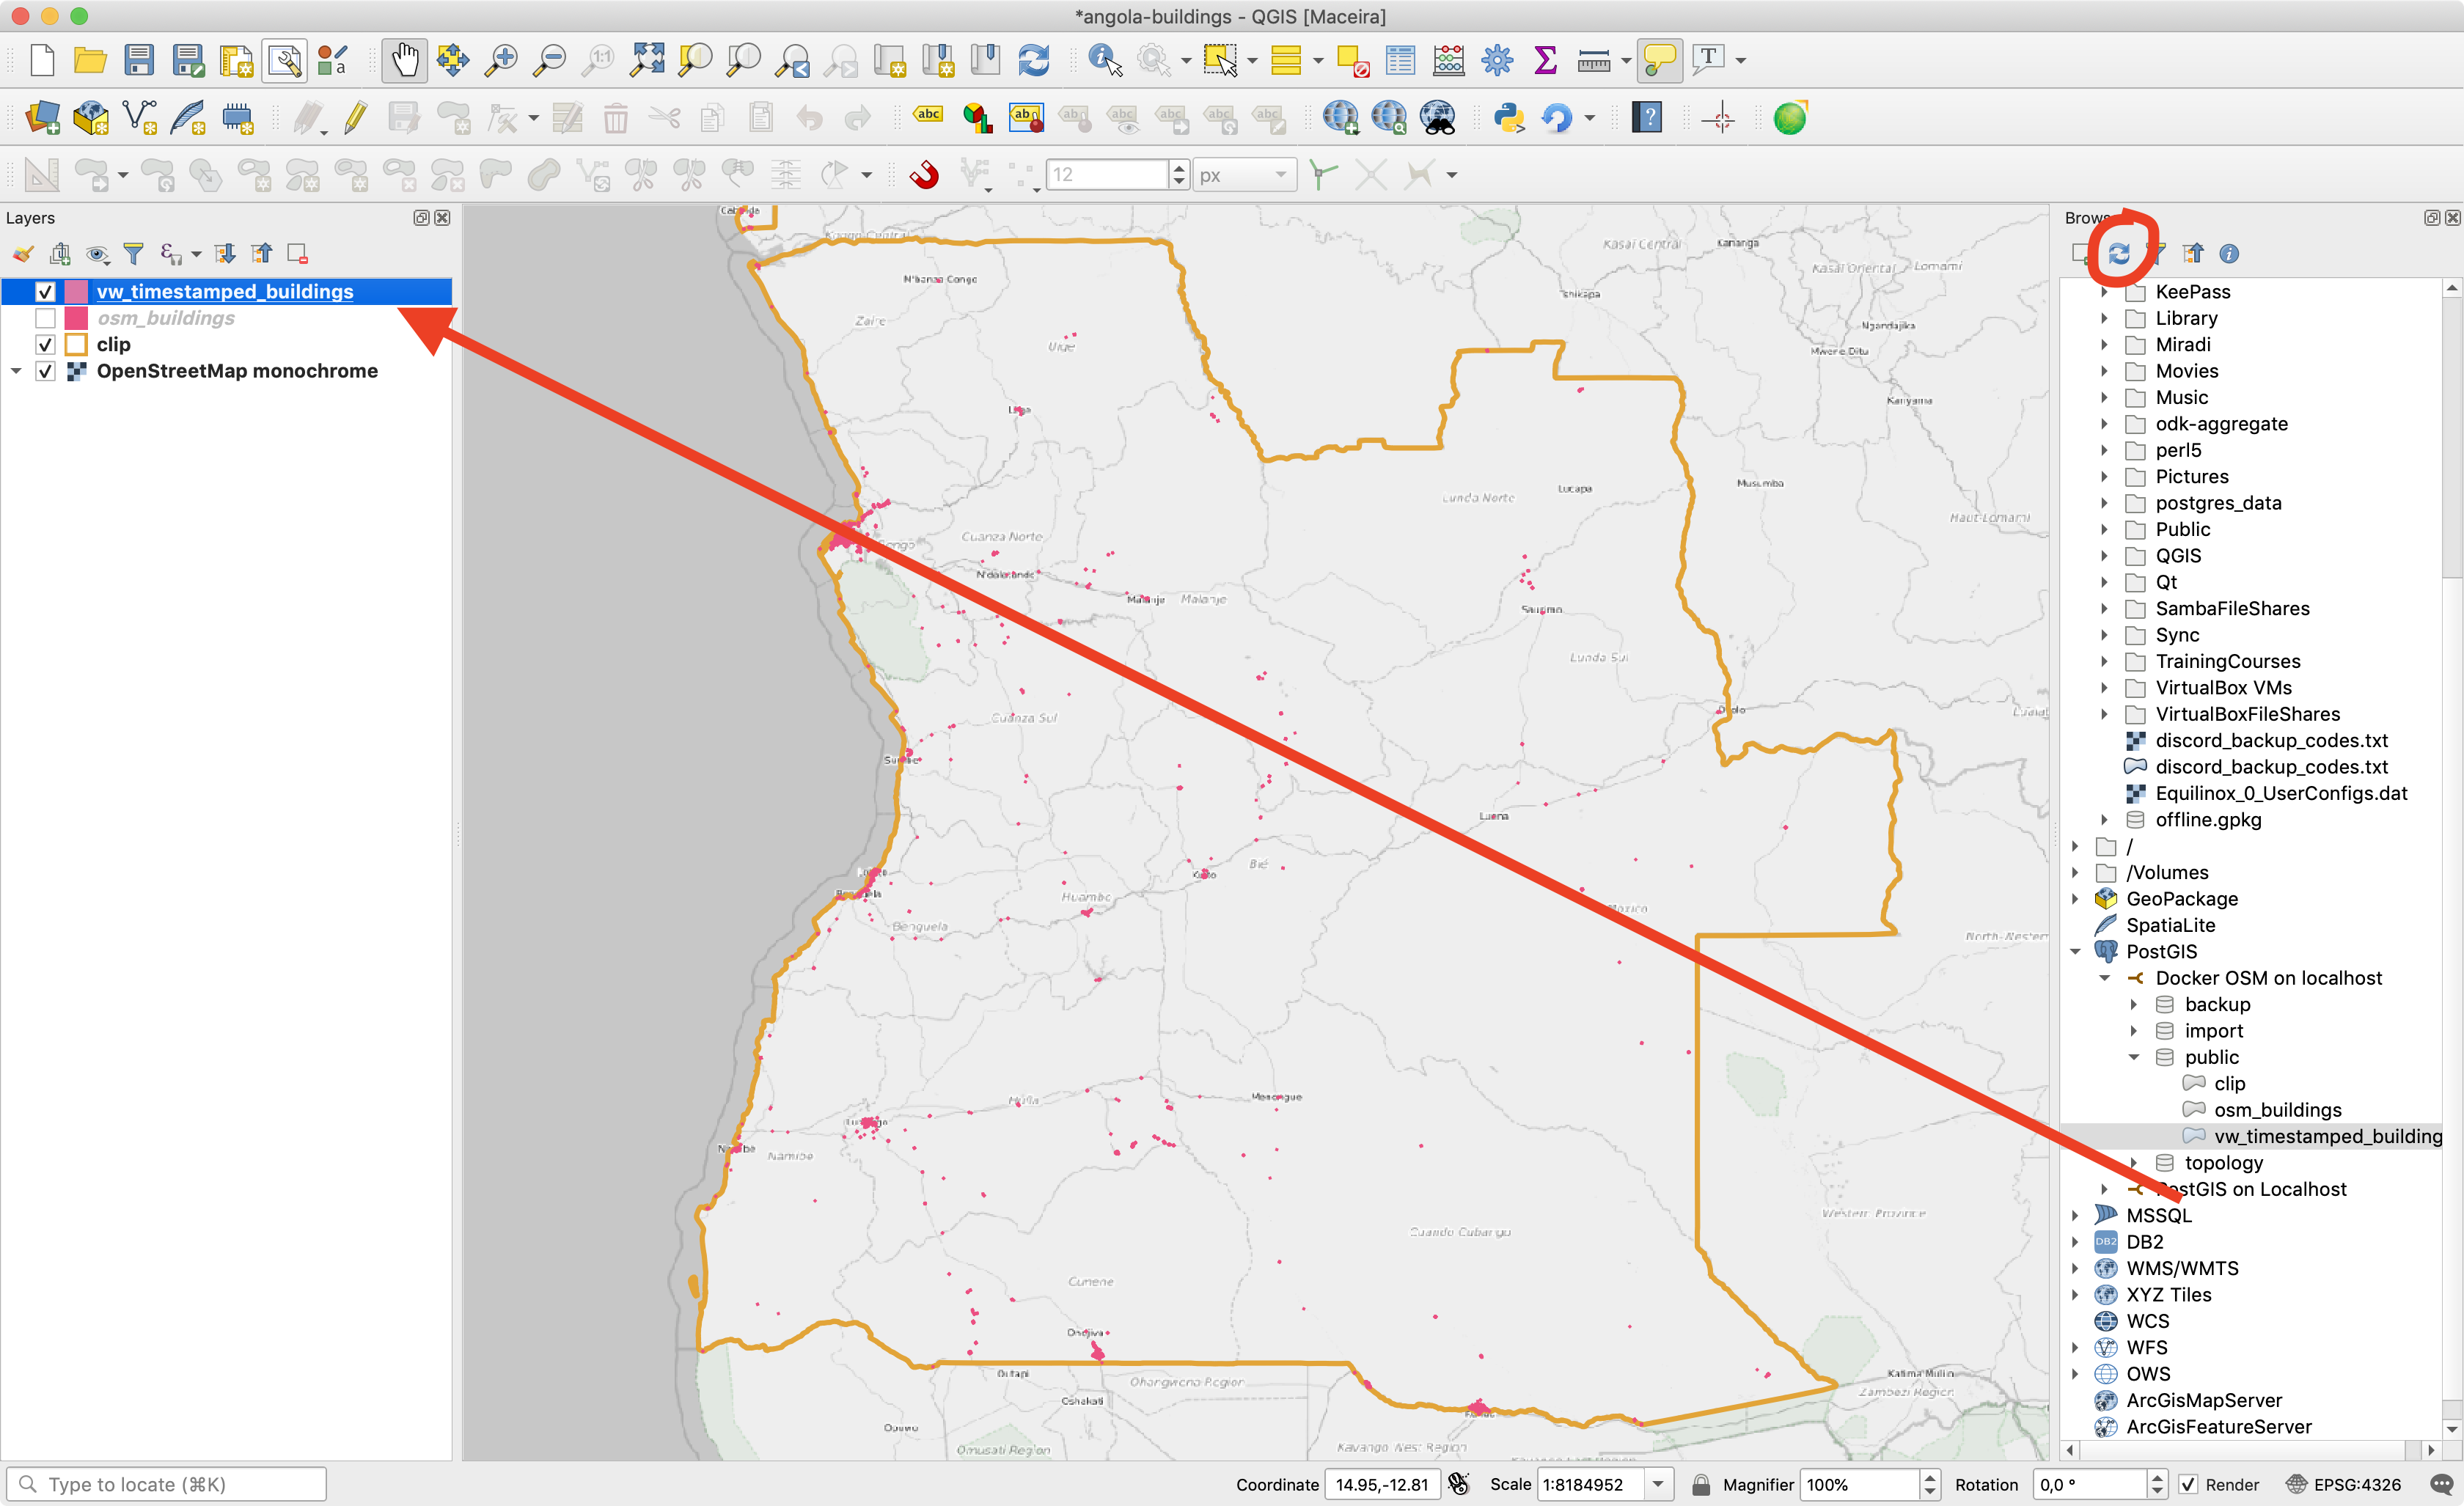
Now refresh your browser panel using the (circled below) refresh icon and then drag the view into your project. Create a bold style for your view based layer so that the buildings will be easy to see when you animate the time series.
Next, use the timemanager plugin to add your view to an animation series as shown below. Make sure to check 'Accumulate features' option for your project so that the animation shows the accumulation of buildings over time.
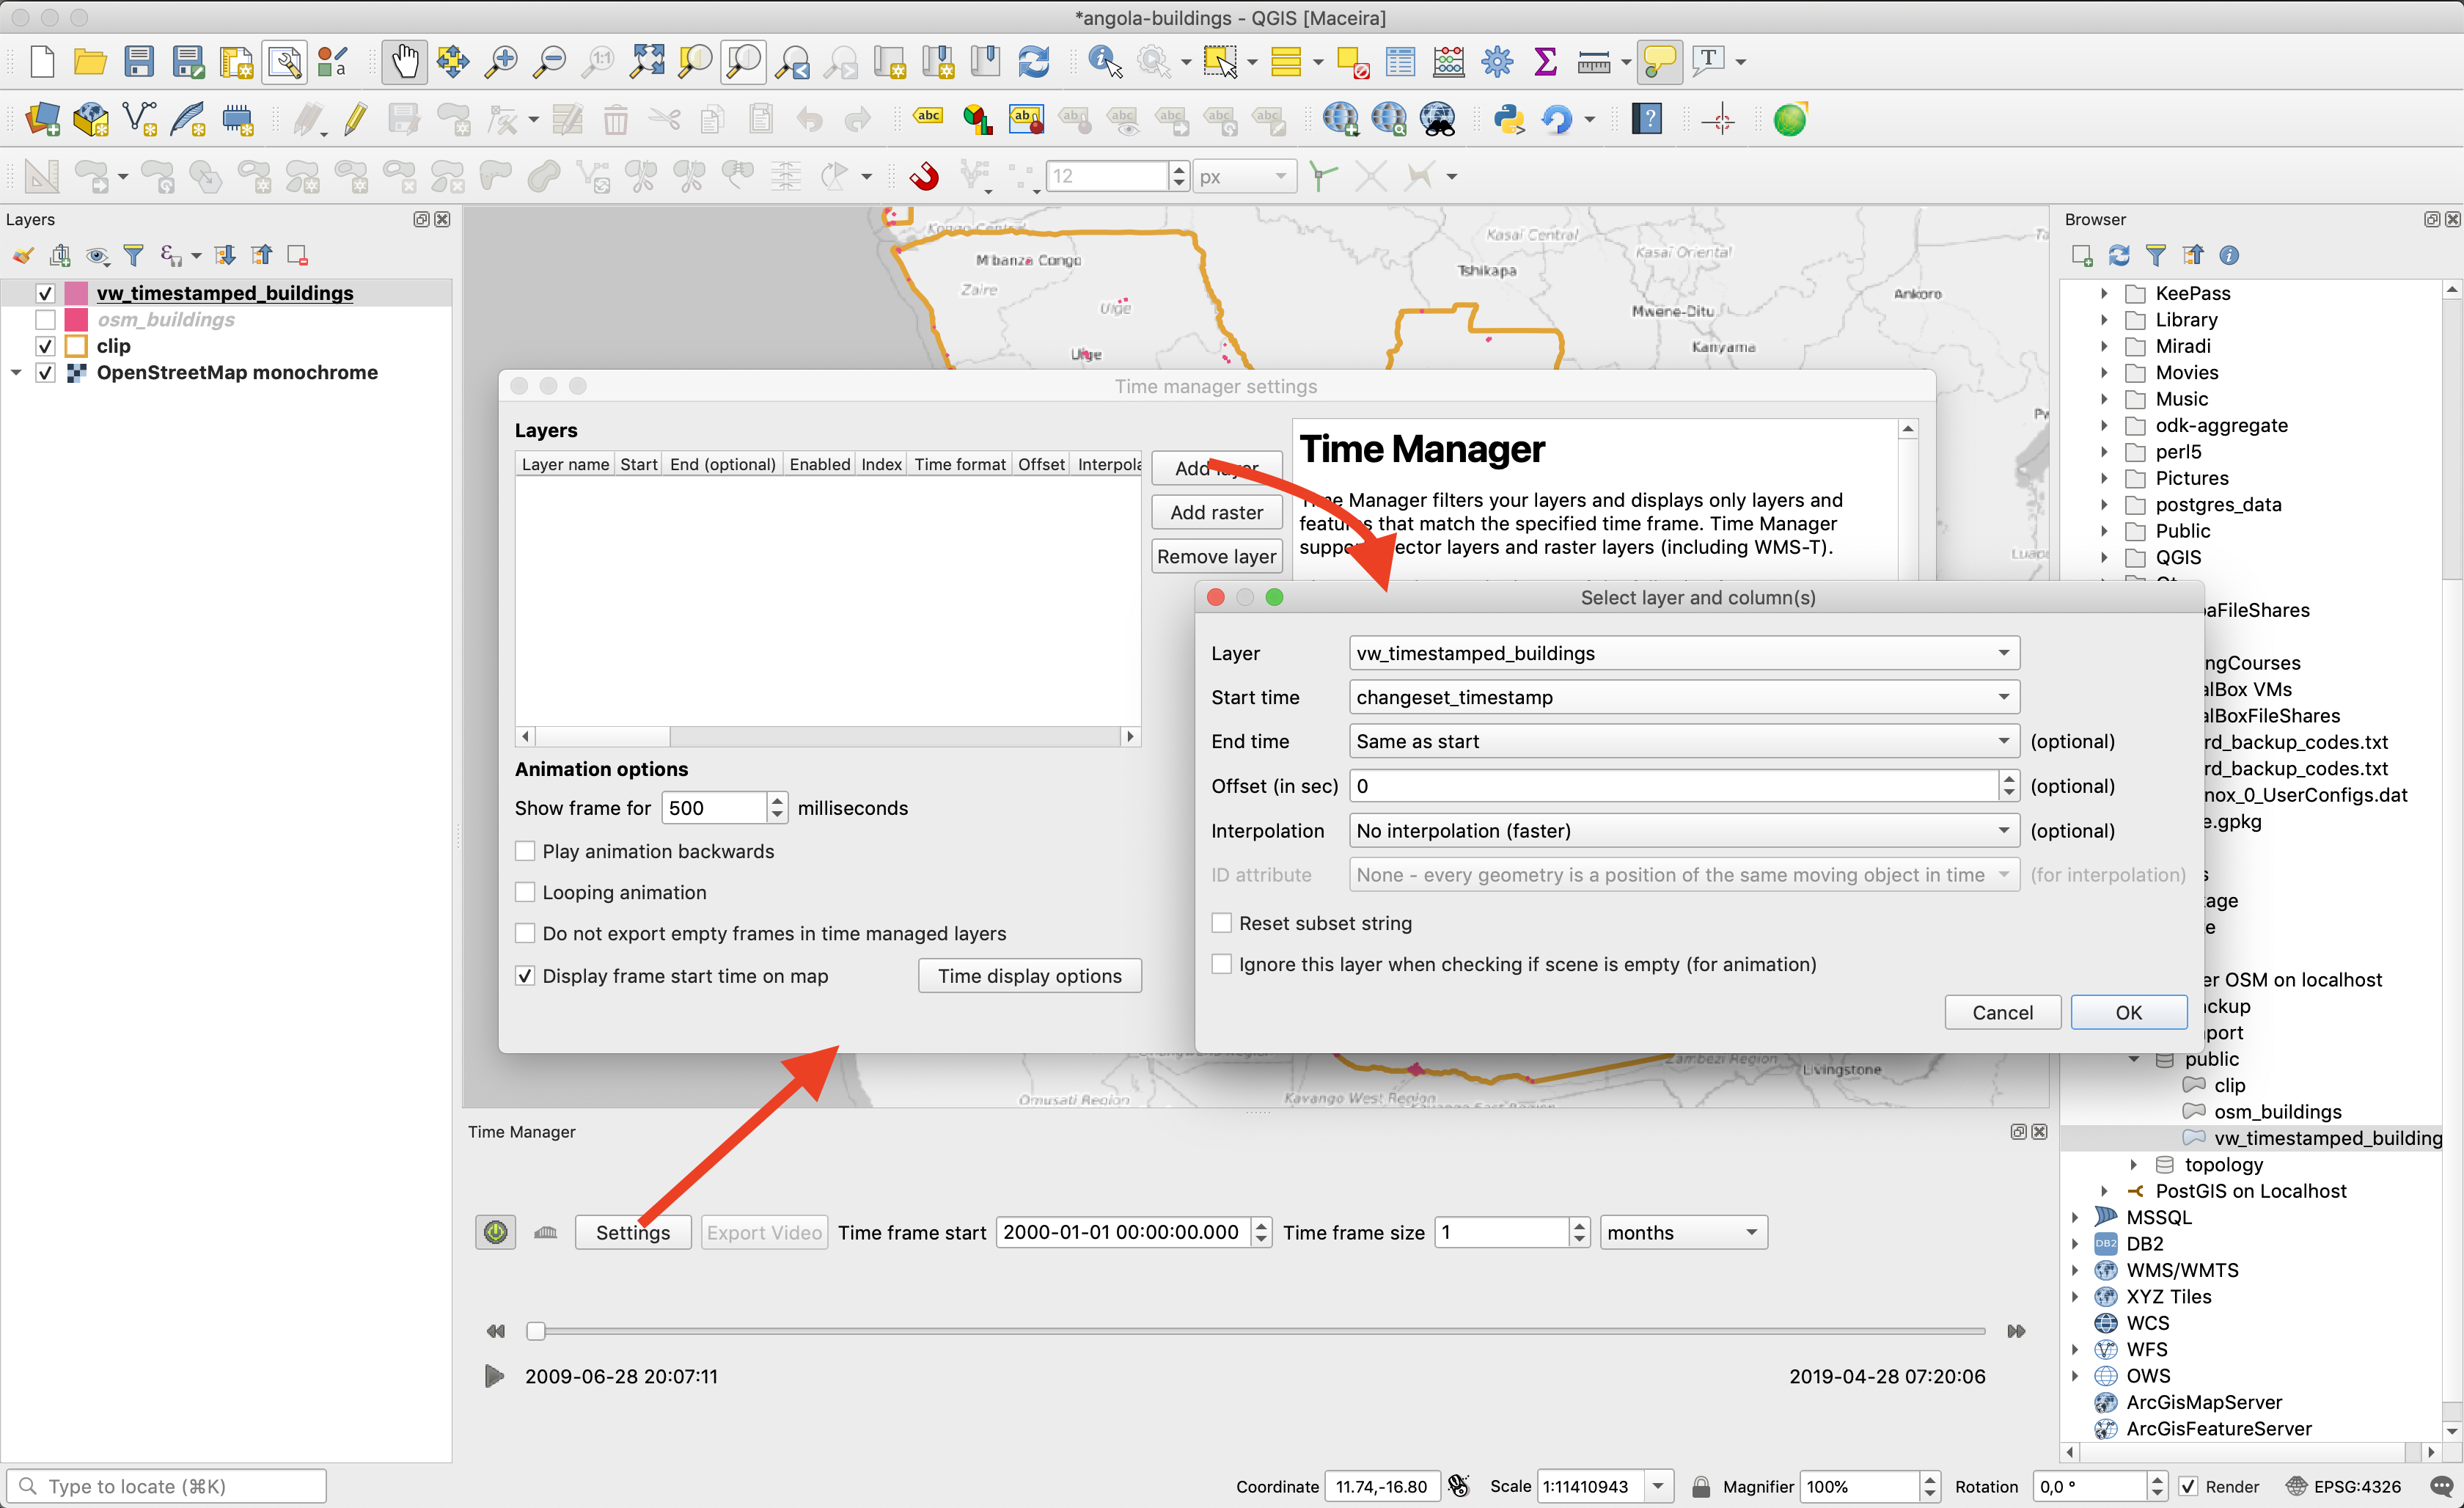
I chose a time interval of 1 month but you may wish to adjust that depending on your needs. I should also mention that timemanager can be a bit fiddly sometimes - if things aren't working right (for example the 'play' button not showing), try restarting QGIS, it seems to help sometimes...
Now test your time series visualisation by scubbing the time slider left and right - you should see the progression of new buildings that have been added to the map.
I then output my series as an animated GIF (check this blog article for hints on creating videos), how to do it is beyond the scope of this article. If you know a bit of imagemagick, here are the options I used:
convert -resize 33% -dither none -deconstruct -layers optimize -matte -depth 8 angola.gif angola-small.gif
And here is an example output:

Getting started with your own settings and region
You can customise the area and mappings file (which determines which OSM features are loaded into the PostGIS database) using the following process:
- Check out the docker-osm-examples repo: https://github.com/kartoza/docker-osm-examples
- Copy one of the directories e.g. angola-buildings
- Go into the new directory you made
- Edit the makefiles: Makefile and docker-osm-settings/Makefile, changing the project_id to something appropriate
- Edit the docker-osm-settings/mapping.yml file (look in the Lisbon example folder for a more complete file which fetches various feature types), leaving only the desired feature attributes you want
- Replace docker-osm-settings/clip/clip.shp with the clip area you want to focus on
- Update the path in docker-osm-settings/Dockerfile in the wget status to fetch the appropriate geofrabrik .pbg resource used to bootstrap your mirror
Then run make deploy as per our simple example above.
Credits
The work presented here is the brainchild of and was developed by:
- Tim Sutton
- Etienne Trimaille (who did most of the initial development work for docker-osm)
- Irwan Fathurrahman
- Yarjuna Rohmat
The initial work was funded by Kartoza and we received subsequent support from WorldBank/GFDRR and DigitalSquare (who funded the OSMENRICH work) via projects we have worked on for those organisations.
Tim Sutton
Tim started his career by working in Nature Conservation in South Africa. Some years later, around 1998, an opening in the newly formed GIS group in the organisation where he worked presented an opportunity to combine his love of the environment with his enthusiasm for computers. What followed quickly became a deep dive into GIS (including obtaining a Master's Degree in GIS and Environmental Studies) and Open Source. He discovered Linux, also around 1998, and became an ardent fan of using and creating Open Source software. The announcement of the first release of QGIS in 2002 was another key milestone, with Tim quickly becoming deeply involved in the development of QGIS, as well as helping to build the community platforms and governance structures around the project. Formerly the QGIS.org Board Chair, Tim was awarded perpetual Honorary QGIS PSC Member status in 2018 and continues to play an active role in many aspects of the QGIS project. Tim is also engaged in the broader Open Source GIS ecosystem, including having the honour of being an OSGEO Charter Member and promoting the wide array of world-changing Open Source GIS tools provided under the OSGEO umbrella (and beyond) to pretty much anyone who will listen.


No comments yet. Login to start a new discussion Start a new discussion