Kartoza - Rendering Points as a Heatmap in GeoServer
A brief walk through on how an SLD to render a Heatmap with Labelled Clusters was made for GeoServer.
Rendering Points as a Heatmap in GeoServer
I was assigned the task of rendering a points layer as a heatmap on GeoServer. The client provided a QGIS style that they wanted replicated using an SLD (Styled Layer Descriptor). Initially, they attempted to export the QGIS style directly as an SLD and upload it to GeoServer. However, this approach failed because QGIS generated the heatmap SLD as:
<?xml version="1.0" encoding="UTF-8"?><StyledLayerDescriptor xmlns="http://www.opengis.net/sld" xsi:schemaLocation="http://www.opengis.net/sld http://schemas.opengis.net/sld/1.1.0/StyledLayerDescriptor.xsd" xmlns:xlink="http://www.w3.org/1999/xlink" xmlns:xsi="http://www.w3.org/2001/XMLSchema-instance" version="1.1.0" xmlns:ogc="http://www.opengis.net/ogc" xmlns:se="http://www.opengis.net/se"><NamedLayer><se:Name>Current_Layer</se:Name><UserStyle><se:Name>Current_style</se:Name><se:FeatureTypeStyle><!--FeatureRenderer heatmapRenderer not implemented yet--></se:FeatureTypeStyle></UserStyle></NamedLayer></StyledLayerDescriptor>
The main issue was the line:
<!--FeatureRenderer heatmapRenderer not implemented yet-->
, indicating that the style was essentially saved as blank or non-renderable. This was simply how the style was exported from QGIS.
The first step in addressing the request was to visit the GeoServer Styling Manual and see if there was any example documentation that could help. There was an explanation of how to generate a heatmap style in the Rendering Transformations' Heatmap Generation documentation as well as an example of a heatmap SLD.
Using the example from the documentation as a basis, I made a few adjustments to ensure the style met the client’s requirements. Here is what the initial heatmap style looked like:
<?xml version="1.0" encoding="ISO-8859-1"?><StyledLayerDescriptor version="1.0.0"xsi:schemaLocation="http://www.opengis.net/sld StyledLayerDescriptor.xsd"xmlns="http://www.opengis.net/sld"xmlns:ogc="http://www.opengis.net/ogc"xmlns:xlink="http://www.w3.org/1999/xlink"xmlns:xsi="http://www.w3.org/2001/XMLSchema-instance"><NamedLayer><Name>Heatmap Style</Name><UserStyle><Title>Heatmap Style</Title><Abstract></Abstract><FeatureTypeStyle><Transformation><ogc:Function name="vec:Heatmap"><ogc:Function name="parameter"><ogc:Literal>data</ogc:Literal></ogc:Function><ogc:Function name="parameter"><ogc:Literal>weightAttr</ogc:Literal><ogc:Literal>geometry</ogc:Literal></ogc:Function><ogc:Function name="parameter"><ogc:Literal>radiusPixels</ogc:Literal><ogc:Literal>75</ogc:Literal> <!-- Spread of heatmap around points, set a number below 100 to reduce spread of heatmap --></ogc:Function><ogc:Function name="parameter"><ogc:Literal>pixelsPerCell</ogc:Literal><ogc:Literal>5</ogc:Literal> <!-- Set a small number here to generate a higher resolution heatmap --></ogc:Function><ogc:Function name="parameter"><ogc:Literal>outputBBOX</ogc:Literal><ogc:Function name="env"><ogc:Literal>wms_bbox</ogc:Literal></ogc:Function></ogc:Function><ogc:Function name="parameter"><ogc:Literal>outputWidth</ogc:Literal><ogc:Function name="env"><ogc:Literal>wms_width</ogc:Literal></ogc:Function></ogc:Function><ogc:Function name="parameter"><ogc:Literal>outputHeight</ogc:Literal><ogc:Function name="env"><ogc:Literal>wms_height</ogc:Literal></ogc:Function></ogc:Function></ogc:Function></Transformation><Rule><RasterSymbolizer><Geometry><ogc:PropertyName>geometry</ogc:PropertyName></Geometry><Opacity>0.5</Opacity><ColorMap type="ramp"> <!-- The quantity specifies the percentage of the data range on which to change the colour --><ColorMapEntry color="#FFFFFF" quantity="0" label="" opacity="0"/> <!-- This is needed to have empty areas around the heatmap 'islands' --><ColorMapEntry color="#4444FF" quantity=".1" label=""/><ColorMapEntry color="#00FFAE" quantity=".3" label=""/><ColorMapEntry color="#FF0000" quantity=".5" label="" /><ColorMapEntry color="#FFAE00" quantity=".75" label=""/><ColorMapEntry color="#FFFF00" quantity="1.0" label="" /></ColorMap></RasterSymbolizer></Rule></FeatureTypeStyle></UserStyle></NamedLayer></StyledLayerDescriptor>
Inline comments were added to the SLD to help the client understand which lines they could modify if needed.
The primary adjustments made to the example style are as follows:
- Setting the `weightAttr` as `geometry` so that specified input attribute is the geometry of the various points.
- Adjusting the `radiusPixels` and the `pixelsPerCell` values.
- Adding additional stops in the colour ramp.
- Changing the hexcodes of the colours in the colour ramp to be the same as the example heatmap.
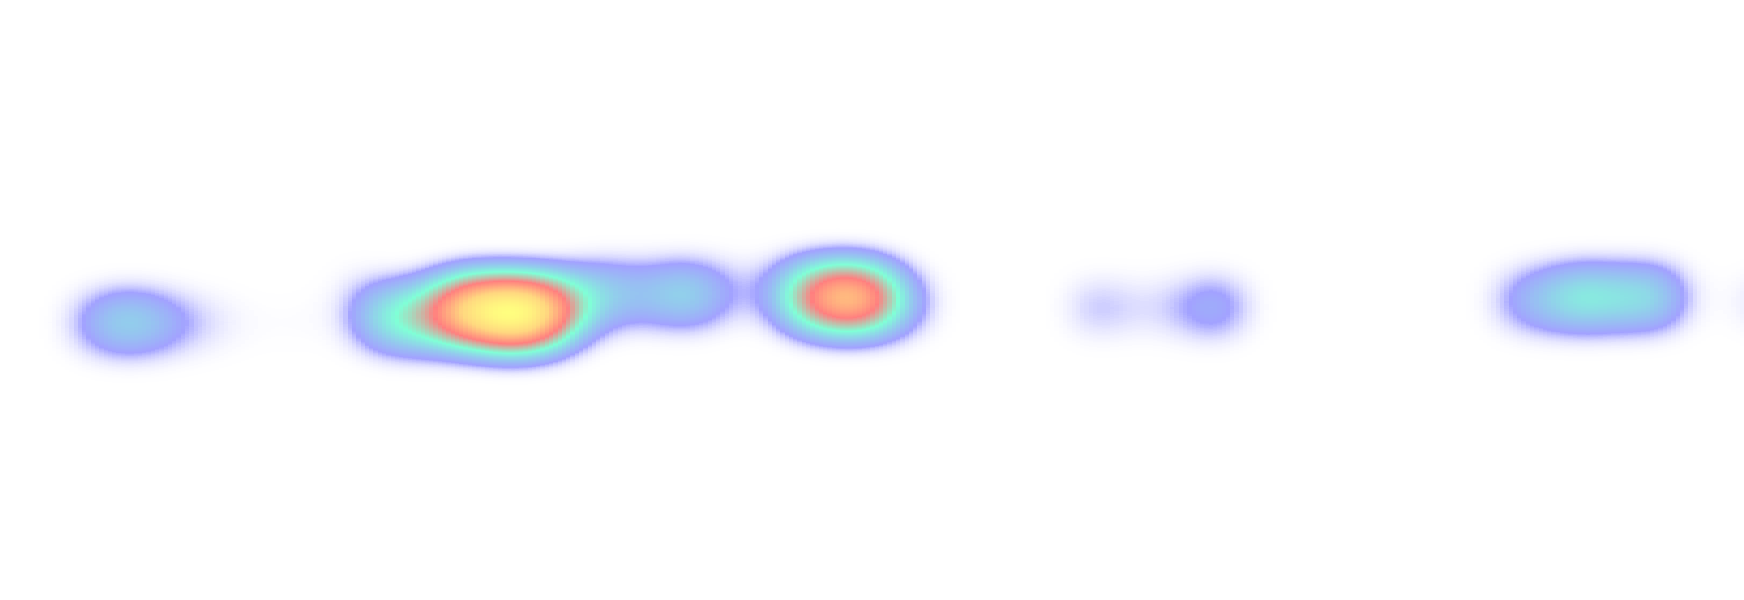
While generating the heatmap style, an issue frequently occurred with GeoServer’s built-in style previewer, which did not display the style accurately. As a result, I had to check the results on the front-end map after every change. This limitation is evident in the screenshot below, where the GeoServer preview lacks a proper front-end to display the styled dummy data, making it appear different from how it would look on an actual map.

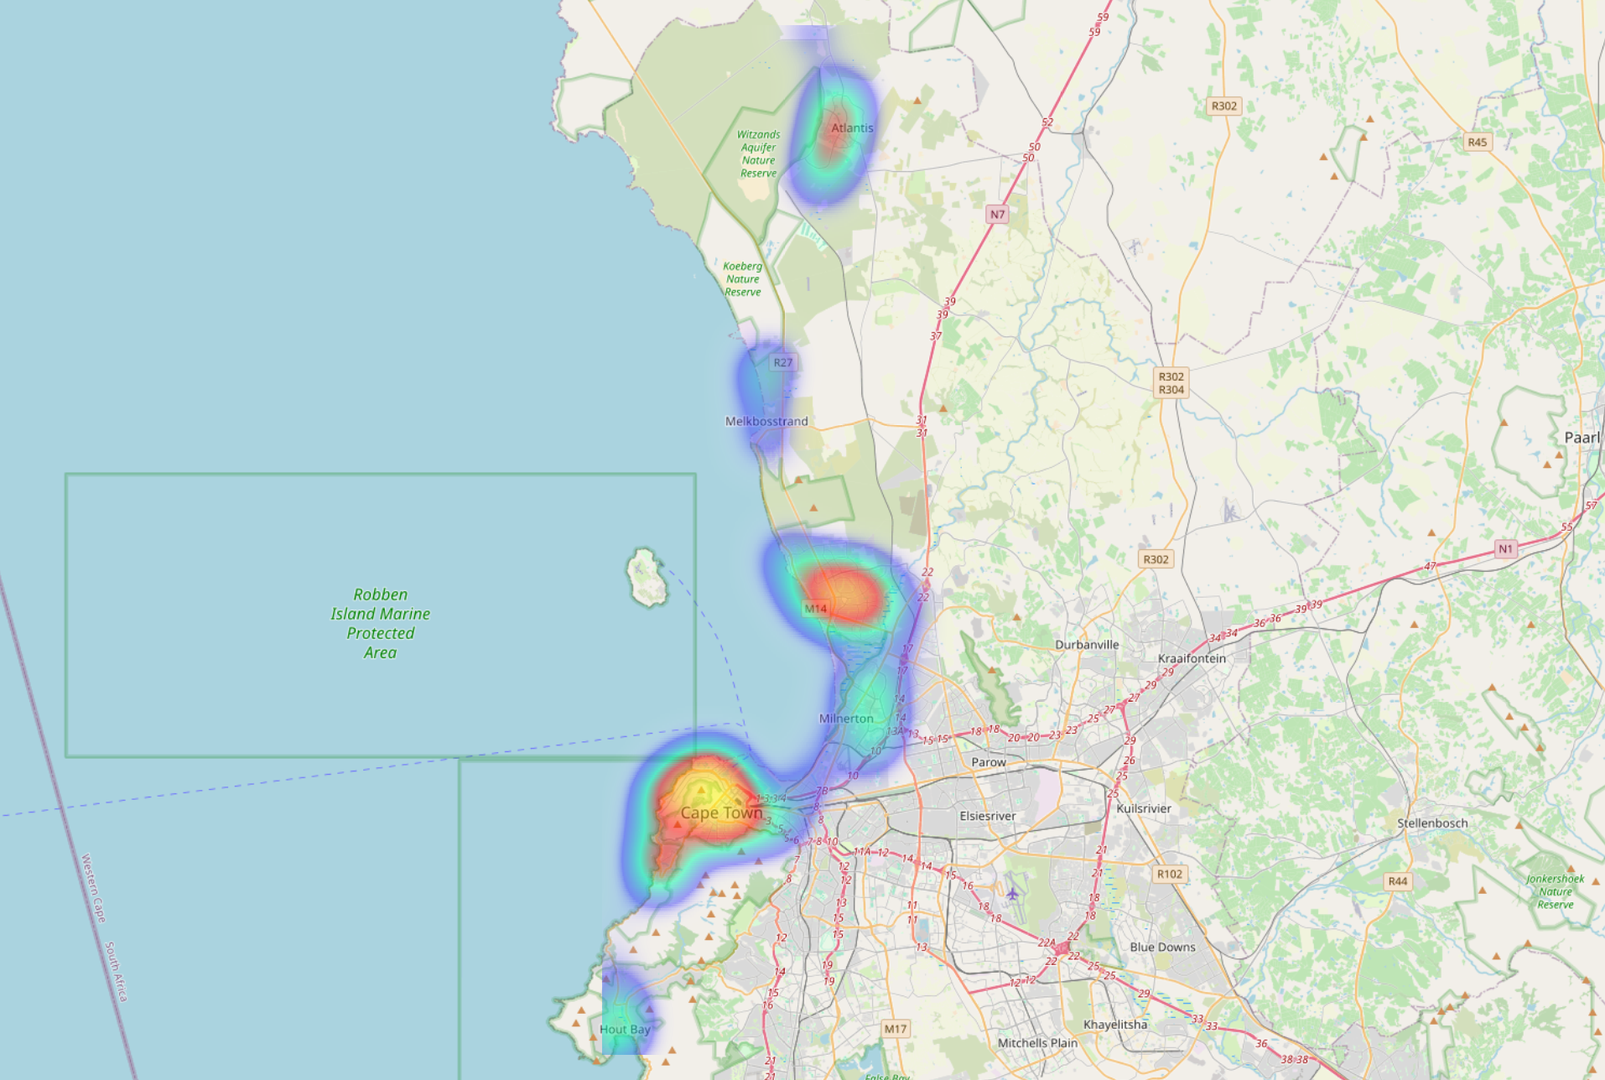
The generated heatmap looked like this when rendered correctly (this is dummy data and not the actual data):

The client was pleased with the heatmap but later requested additional functionality: displaying the relative counts of the various heatmap surfaces. This prompted me to research whether anyone had implemented something similar that I could use as a reference. After an extensive search yielded no results, I decided to experiment and create a custom SLD to meet the client’s requirements.
I had previously been shown and used the Point Stacker logic in GeoServer to do clustered symbol displays so I used this as my base logic. The whole logic behind the clustered labelling display didn't need to be complex. All the labels would be the same size, and font, and they just needed to display a relative count.
Given these criteria, I modified my existing Point Stacker logic to be simplified and it looked like this:
<FeatureTypeStyle><Transformation><ogc:Function name="gs:PointStacker"><ogc:Function name="parameter"><ogc:Literal>data</ogc:Literal></ogc:Function><ogc:Function name="parameter"><ogc:Literal>cellSize</ogc:Literal><ogc:Literal>20</ogc:Literal></ogc:Function><ogc:Function name="parameter"><ogc:Literal>outputBBOX</ogc:Literal><ogc:Function name="env"><ogc:Literal>wms_bbox</ogc:Literal></ogc:Function></ogc:Function><ogc:Function name="parameter"><ogc:Literal>outputWidth</ogc:Literal><ogc:Function name="env"><ogc:Literal>wms_width</ogc:Literal></ogc:Function></ogc:Function><ogc:Function name="parameter"><ogc:Literal>outputHeight</ogc:Literal><ogc:Function name="env"><ogc:Literal>wms_height</ogc:Literal></ogc:Function></ogc:Function></ogc:Function></Transformation><Rule><Name>Clusters</Name><Title>Clusters</Title><ogc:Filter><ogc:PropertyIsGreaterThanOrEqualTo><ogc:PropertyName>count</ogc:PropertyName><ogc:Literal>5</ogc:Literal></ogc:PropertyIsGreaterThanOrEqualTo></ogc:Filter><TextSymbolizer><Label><ogc:PropertyName>count</ogc:PropertyName></Label><Font><CssParameter name="font-family">Arial</CssParameter><CssParameter name="font-size">10</CssParameter><CssParameter name="font-weight">bold</CssParameter></Font><LabelPlacement><PointPlacement><AnchorPoint><AnchorPointX>0</AnchorPointX><AnchorPointY>0</AnchorPointY></AnchorPoint></PointPlacement></LabelPlacement><Halo><Radius>0.4</Radius><Fill><CssParameter name="fill">#000000</CssParameter><CssParameter name="fill-opacity">1</CssParameter></Fill></Halo><Fill><CssParameter name="fill">#FFFFFF</CssParameter><CssParameter name="fill-opacity">1.0</CssParameter></Fill></TextSymbolizer></Rule></FeatureTypeStyle>
There is only one clustering rule as having different sized circles symbolizing different sized clusters was not needed. The `cellSize` was set to 20 map units so that all points within a grid cell of 20x20 map units get clustered together. The `count` property was set to be greater than or equal to 5, as during the creation of the style, it became apparent that labelling all of the clusters with fewer than 5 points overcrowded the map visually and did not add any more information.
The next step was combining the logic for the heatmap and the labelled clusters. After multiple failed attempts, I found that I couldn't combine the two logics into one `FeatureTypeStyle` and needed two separate `FeatureTypeStyle` groups. From there I then played around with the ordering of the `FeatureTypeStyle` logic and learnt that the heatmap style needed to come first in the SLD.
All the attempts led to this style:
<?xml version="1.0" encoding="ISO-8859-1"?><StyledLayerDescriptor version="1.0.0"xsi:schemaLocation="http://www.opengis.net/sld StyledLayerDescriptor.xsd"xmlns="http://www.opengis.net/sld"xmlns:ogc="http://www.opengis.net/ogc"xmlns:xlink="http://www.w3.org/1999/xlink"xmlns:xsi="http://www.w3.org/2001/XMLSchema-instance"xmlns:se="http://www.opengis.net/se"><NamedLayer><Name>Cluster points</Name><UserStyle><!-- Styles can have names, titles and abstracts --><Title>Clustered points</Title><Abstract>Styling using cluster points server side</Abstract><FeatureTypeStyle><Transformation><ogc:Function name="vec:Heatmap"><ogc:Function name="parameter"><ogc:Literal>data</ogc:Literal></ogc:Function><ogc:Function name="parameter"><ogc:Literal>weightAttr</ogc:Literal><ogc:Literal>geometry</ogc:Literal></ogc:Function><!-- Set a very small radius or remove this parameter --><ogc:Function name="parameter"><ogc:Literal>radiusPixels</ogc:Literal><ogc:Literal>75</ogc:Literal> <!-- Reduced radius --></ogc:Function><ogc:Function name="parameter"><ogc:Literal>pixelsPerCell</ogc:Literal><ogc:Literal>5</ogc:Literal></ogc:Function><ogc:Function name="parameter"><ogc:Literal>outputBBOX</ogc:Literal><ogc:Function name="env"><ogc:Literal>wms_bbox</ogc:Literal></ogc:Function></ogc:Function><ogc:Function name="parameter"><ogc:Literal>outputWidth</ogc:Literal><ogc:Function name="env"><ogc:Literal>wms_width</ogc:Literal></ogc:Function></ogc:Function><ogc:Function name="parameter"><ogc:Literal>outputHeight</ogc:Literal><ogc:Function name="env"><ogc:Literal>wms_height</ogc:Literal></ogc:Function></ogc:Function></ogc:Function></Transformation><Rule><RasterSymbolizer><Geometry><ogc:PropertyName>geometry</ogc:PropertyName></Geometry><Opacity>0.5</Opacity><ColorMap type="ramp"><ColorMapEntry color="#FFFFFF" quantity="0" label="" opacity="0"/><ColorMapEntry color="#4444FF" quantity=".1" label=""/><ColorMapEntry color="#00FFAE" quantity=".3" label=""/><ColorMapEntry color="#FF0000" quantity=".5" label="" /><ColorMapEntry color="#FFAE00" quantity=".75" label=""/><ColorMapEntry color="#FFFF00" quantity="1.0" label="" /></ColorMap></RasterSymbolizer></Rule></FeatureTypeStyle><!-- Clustering and labelling logic --><FeatureTypeStyle><Transformation><ogc:Function name="gs:PointStacker"><ogc:Function name="parameter"><ogc:Literal>data</ogc:Literal></ogc:Function><ogc:Function name="parameter"><ogc:Literal>cellSize</ogc:Literal><ogc:Literal>20</ogc:Literal></ogc:Function><ogc:Function name="parameter"><ogc:Literal>outputBBOX</ogc:Literal><ogc:Function name="env"><ogc:Literal>wms_bbox</ogc:Literal></ogc:Function></ogc:Function><ogc:Function name="parameter"><ogc:Literal>outputWidth</ogc:Literal><ogc:Function name="env"><ogc:Literal>wms_width</ogc:Literal></ogc:Function></ogc:Function><ogc:Function name="parameter"><ogc:Literal>outputHeight</ogc:Literal><ogc:Function name="env"><ogc:Literal>wms_height</ogc:Literal></ogc:Function></ogc:Function></ogc:Function></Transformation><Rule><Name>Clusters</Name><Title>Clusters</Title><ogc:Filter><ogc:PropertyIsGreaterThanOrEqualTo><ogc:PropertyName>count</ogc:PropertyName><ogc:Literal>5</ogc:Literal></ogc:PropertyIsGreaterThanOrEqualTo></ogc:Filter><TextSymbolizer><Label><ogc:PropertyName>count</ogc:PropertyName></Label><Font><CssParameter name="font-family">Arial</CssParameter><CssParameter name="font-size">10</CssParameter><CssParameter name="font-weight">bold</CssParameter></Font><LabelPlacement><PointPlacement><AnchorPoint><AnchorPointX>0</AnchorPointX><AnchorPointY>0</AnchorPointY></AnchorPoint></PointPlacement></LabelPlacement><Halo><Radius>0.4</Radius><Fill><CssParameter name="fill">#000000</CssParameter><CssParameter name="fill-opacity">1</CssParameter></Fill></Halo><Fill><CssParameter name="fill">#FFFFFF</CssParameter><CssParameter name="fill-opacity">1.0</CssParameter></Fill></TextSymbolizer></Rule></FeatureTypeStyle></UserStyle></NamedLayer></StyledLayerDescriptor>
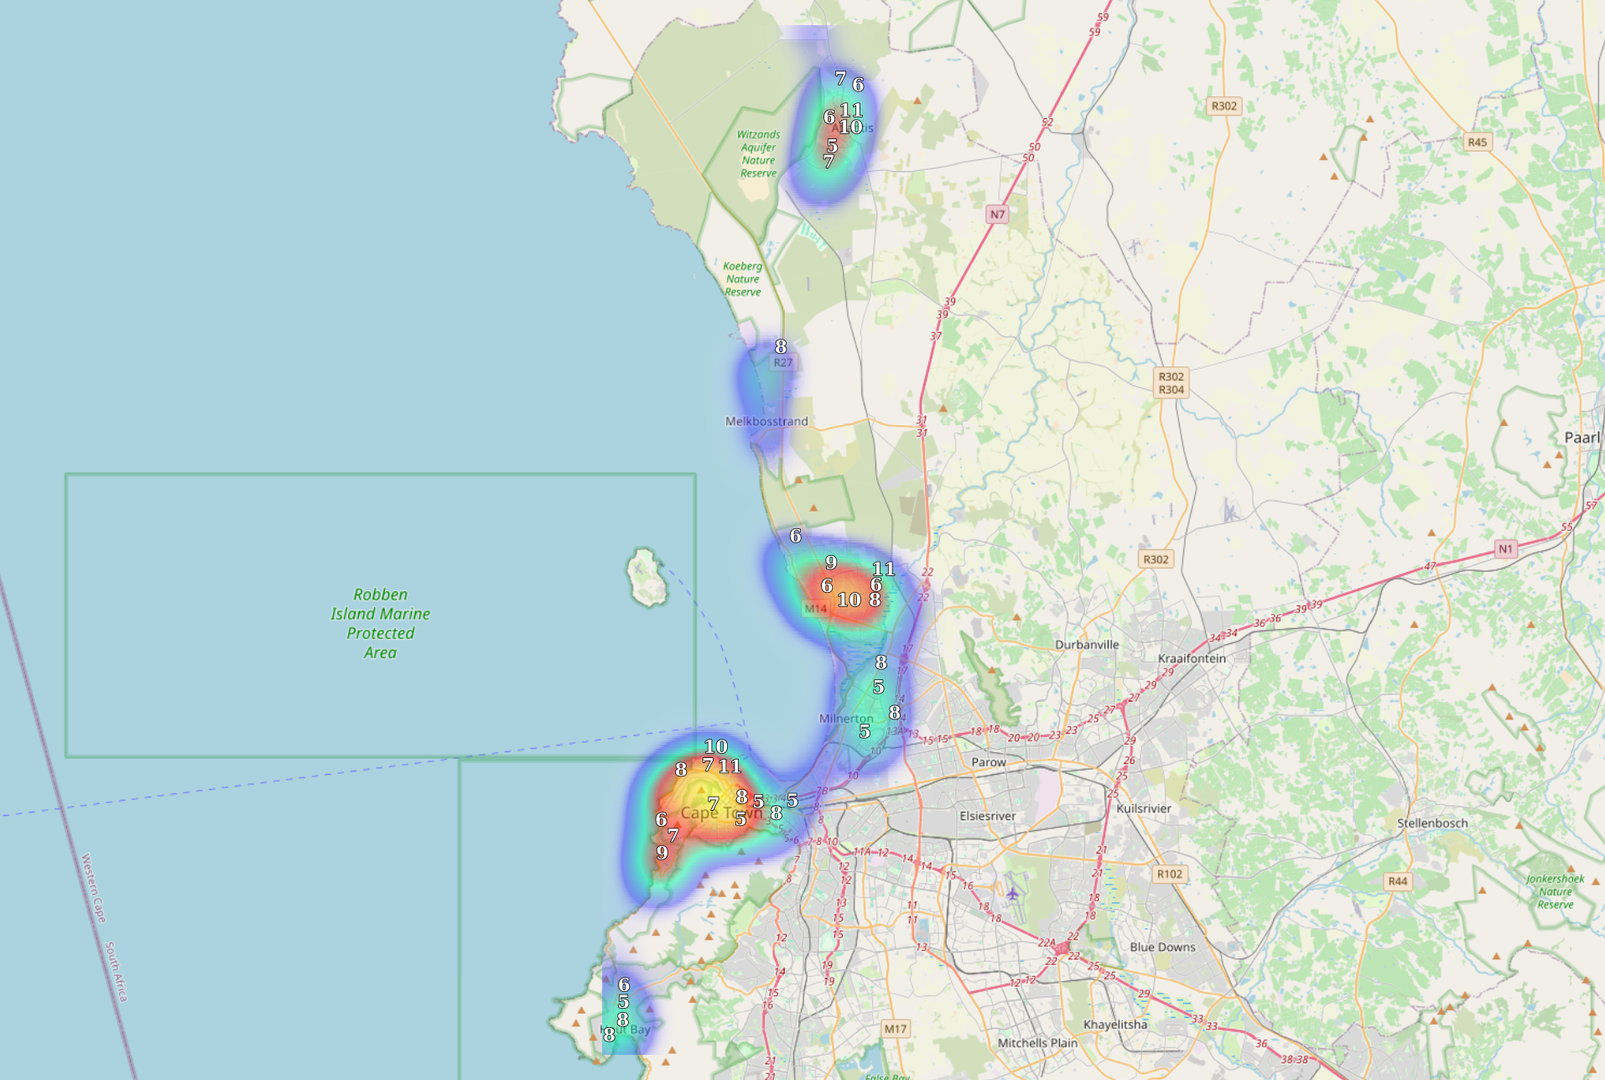
This style renders the points as a heatmap using the `geometry` attribute for weighting and then displays labels for clusters of points that are larger than 5. It looks like this (Again, this is dummy data and not the actual data):

The style is functional and has been approved by the client. However, I would like to revisit the labelling logic to better align it with the heatmap styling. Specifically, I aim to have the labels correspond to the colour breaks in the heatmap rather than relying on a separate clustering logic.

No comments yet. Login to start a new discussion Start a new discussion