Kartoza - Calculating Area of Rasters in QGIS
QGIS raster functionality has come a long way and continues to improve.
QGIS raster functionality has come a long way and continues to improve. During my spare time, I am always on the lookout for interesting questions posed on https://gis.stackexchange.com.
I recently came across https://gis.stackexchange.com/questions/52353/calculating-area-of-rasters-in-qgis where a user asked how to calculate the area of each class in a raster.
The suggested solution involved a three-step approach:
- Recode the raster to simplify the raster classes.
- Vectorize the raster layer.
- Calculation of the statistics from the vector layer either by using SQL (Virtual layers) or native QGIS algorithms.
Although the suggested solution was accepted as an answer it presents a couple of challenges
- It would require a user to pre-process the raster by using the raster calculator, reclassify algorithms from processing, or the r.recode command to allow zonal statistics.
- Vectorization is a CPU intensive process. If the raster layer is very big and the computer resources are low the process could take a very long time to complete.
- The statistics produced cannot be incorporated as part of the raster legend.
I wanted a PyQGIS solution that could also generate the summary statistics as part of the classification legend.
The solution I ended up using involved PyQGIS, python GDAL, and Numpy.
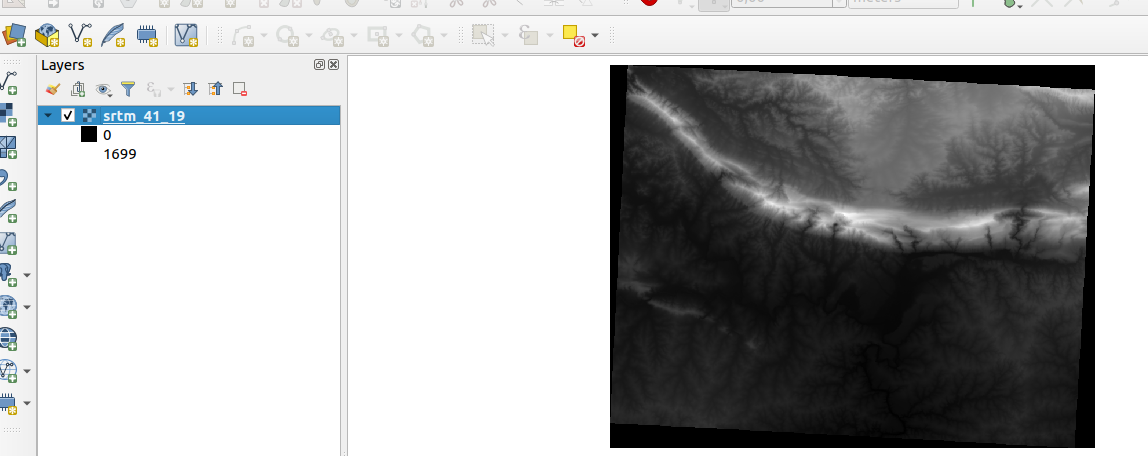
The image below depicts the elevation raster prior to classification
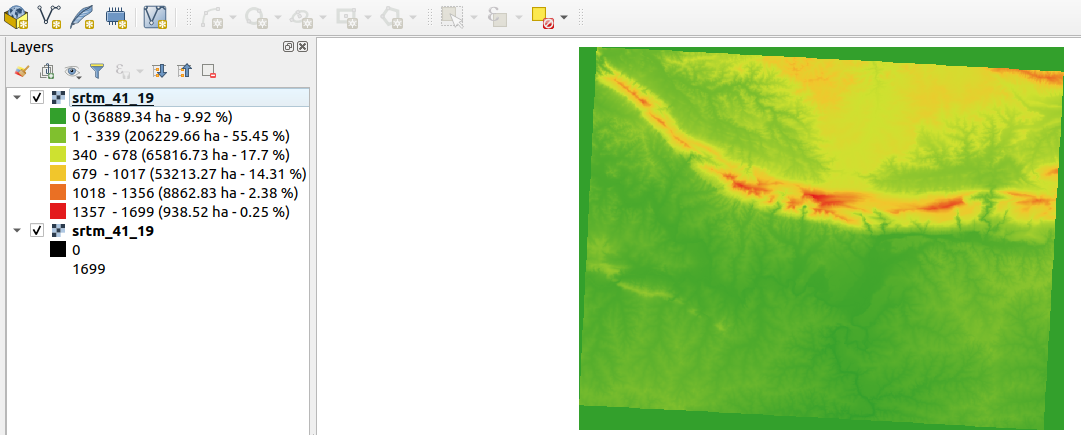
The image below depicts the elevation of the raster post-classification.
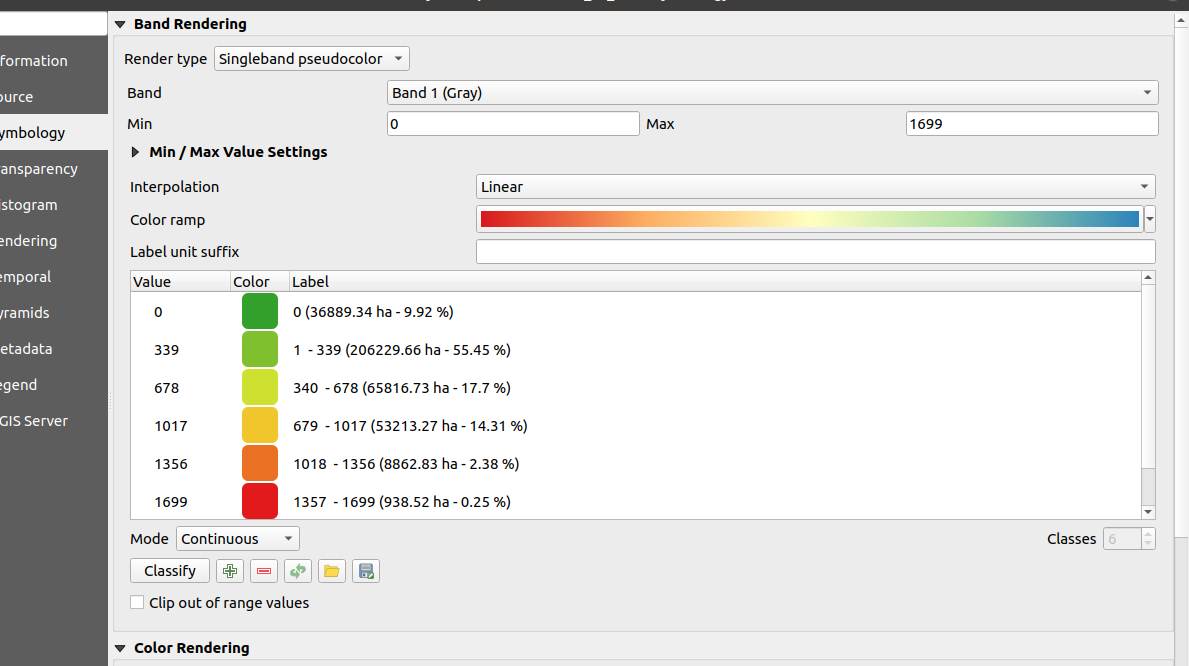
The image below depicts the render type applied to the elevation raster.
Procedure
- Download the script raster_classifier.py from https://gist.github.com/NyakudyaA/b4640ec9d2b5f43fa456083b61cfd12f
- Open the script from a text editor and change the raster path from https://gist.github.com/NyakudyaA/b4640ec9d2b5f43fa456083b61cfd12f#file-raster_classifier-py-L190 to specify your own single-band raster i.e you can use the SRTM Downloader plugin in QGIS to download a DEM.
- Navigate to QGIS and open the python console.
- Open the editor and load your script raster_classifier.py.
- Run the script and your raster is then loaded into QGIS.
A summary of the script is provided below
The script will emulate how a user would symbolise a single band raster using the GUI in QGIS.
- The input raster should ideally be projected. If the CRS of the raster is EPSG:4326 it will be converted to EPSG:3857. It is encouraged to use your local projection or UTM projection for a more accurate area calculation.
- The function get_raster_area is used to calculate the total area of the raster. This is achieved by getting the total area of each cell and then multiply by the number of cells in the coverage raster.
- The function get_area calculates the total area of each color range by using the NumPy. It calculates the pixels that are within a given color range and then the total area of such.
- The function mini_style creates a color ramp shader. The color ramp shader will define the new color ramp we create to symbolise the raster. Interpolation stretches colors across a range of values specified by the min/max values of the raster. Because we are symbolising the DEM, which is continuous data, we use the 'Interpolated' method.
- The function style_raster defines the color ranges used to symbolise the raster, calculate the percentage coverage of each class with relation to the total area of the raster. Six classes are defined by calculating the min, max, and ranges from the raster statistics.
- The final classified raster will show a legend with an area calculation for each class. The summary stats will also show the percentage area for each class


No comments yet. Login to start a new discussion Start a new discussion