Kartoza - The Kartoza Intern's Journey Creating a Field Survey with QGIS, Mergin and Input
Input is a FOSS application created by Lutra consulting that brings the power of QGIS to a portable device for data collection.
Simple, powerful and efficient field data collection is vital for any project with a geospatial aspect. Input is a FOSS application created by Lutra consulting that brings the power of QGIS to a portable device for data collection. The Kartoza intern team was challenged to get to grips with Input. The team decided to keep it simple and create a project to collect data from local parks, including paths, trees and infrastructure. This blog follows the journey taken by the team and includes tips and tricks to help novice users.
The Input workflow can be split into three parts: 1) a mobile field data collection solution (Input), 2) a data storage and synchronisation solution (Mergin) and 3) an office desktop solution (QGIS). Input is essentially a mobile version of QGIS. Input can be downloaded and installed free of charge to Android and iOS phones and/or tablets.
The intern team started with an introductory video presented by Hans van der Kwast on the creation of field surveys using QGIS, Mergin and Input. There is also a completely free step-by-step tutorial and sample data to experiment with associated with the introductory video. The intern team, with a background using QGIS, found the video guide sufficient to get started creating a project.
Firstly, each member of the intern group registered themselves for a Mergin account (Fig.1). Mergin is a cloud service that allows for the storage, administration and synchronization of Geo-data. Data stored in Mergin can be managed from the Mergin website, the Input application, or in QGIS using the Mergin plugin (Fig.2). Mergin is used to share projects with other Mergin users. With the QGIS plugin, you can create, delete and synchronise projects and data to local storage.
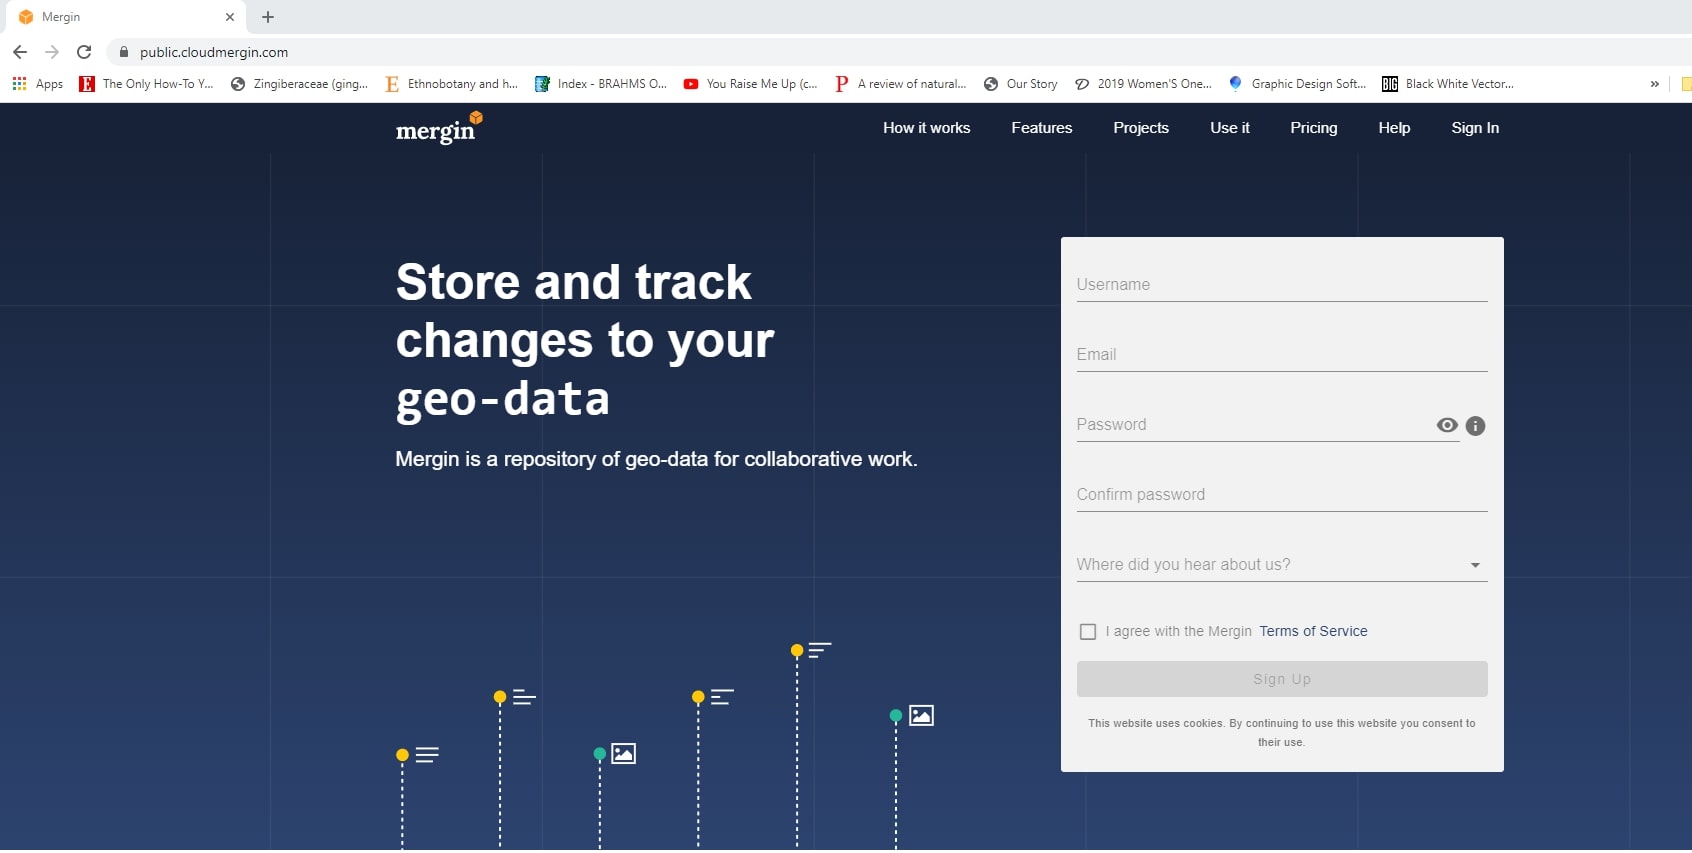
Figure 1: The Mergin website with registration information form.
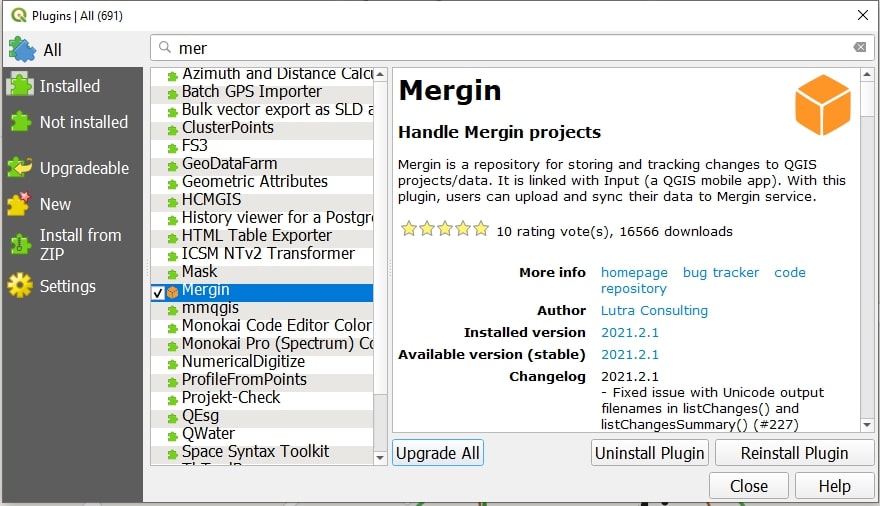
Figure 2: The Mergin plugin available in the QGIS plugin manager.
A QGIS project for field data collection is simple to create; even for beginners. To start open a new QGIS project and save all the data into a single .qgs (file type recognized by Input) project file. Firstly, in the project create context by including base maps. the interns used online base maps due to an urban setting with a constant mobile data connection. The interns chose an OpenStreetMap (OSM) base map because it gives helpful context in urban areas. There are multiple options for online maps. Users can use the QuickMapServices plugin or other web map services to get base maps. The interns chose to include Google satellite and Google street map to the parks project (Fig.3).
Offline layers are essential in field collection instances where there is no access to the Internet or mobile data. For OSM to be available offline, it needs to be converted to MBTiles. For further tips and step-by-step instructions on adding different base maps and images and converting them into offline versions, see the project free tutorial and video linked above.
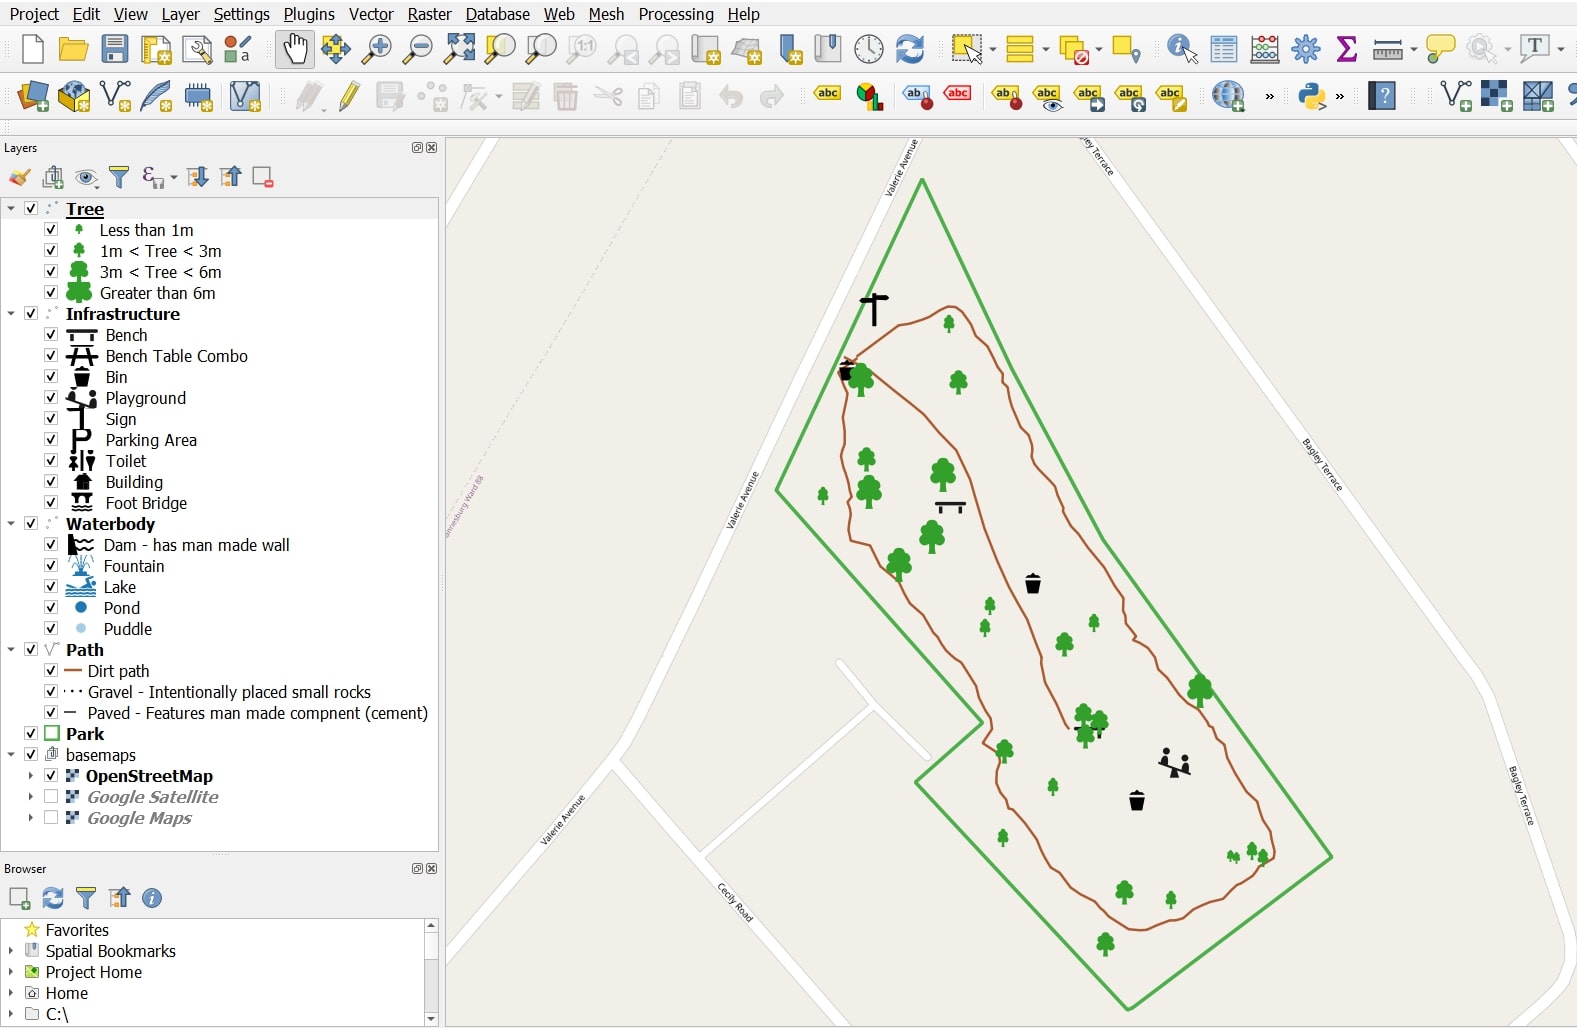
Figure 3: Image showing the finished parks project with separate layers created for different data being collected, three different base maps for context, and symbology applied to the collected data.
Before creating any layers or forms in QGIS, it is essential to have a good idea of the structure of the data schema you would like to use and how the data will be collected. For example what data is being collected in the attribute table and how it is structured. A clear data schema will make creating forms and overall project more efficient and user-friendly. To create layers for data collection, first create a new GeoPackage for the vector layer's geometry (point, line, or polygon) to be stored into. The interns quickly discovered that it is more efficient to have separate layers for each different data type. For example, instead of having single point layers to collect the geographic and attribute information for trees and infrastructure, it is better to have two separate layers with data collection forms for each (Fig.3). The attribute fields needed for the data collection (e.g., fid, observer_id, tree height, timestamp, photograph, etc. Fig.4) should be added while creating the new layer but can be added later using the Fields tab in the Layer Properties (Fig.4). The layers created will be empty of geometry.
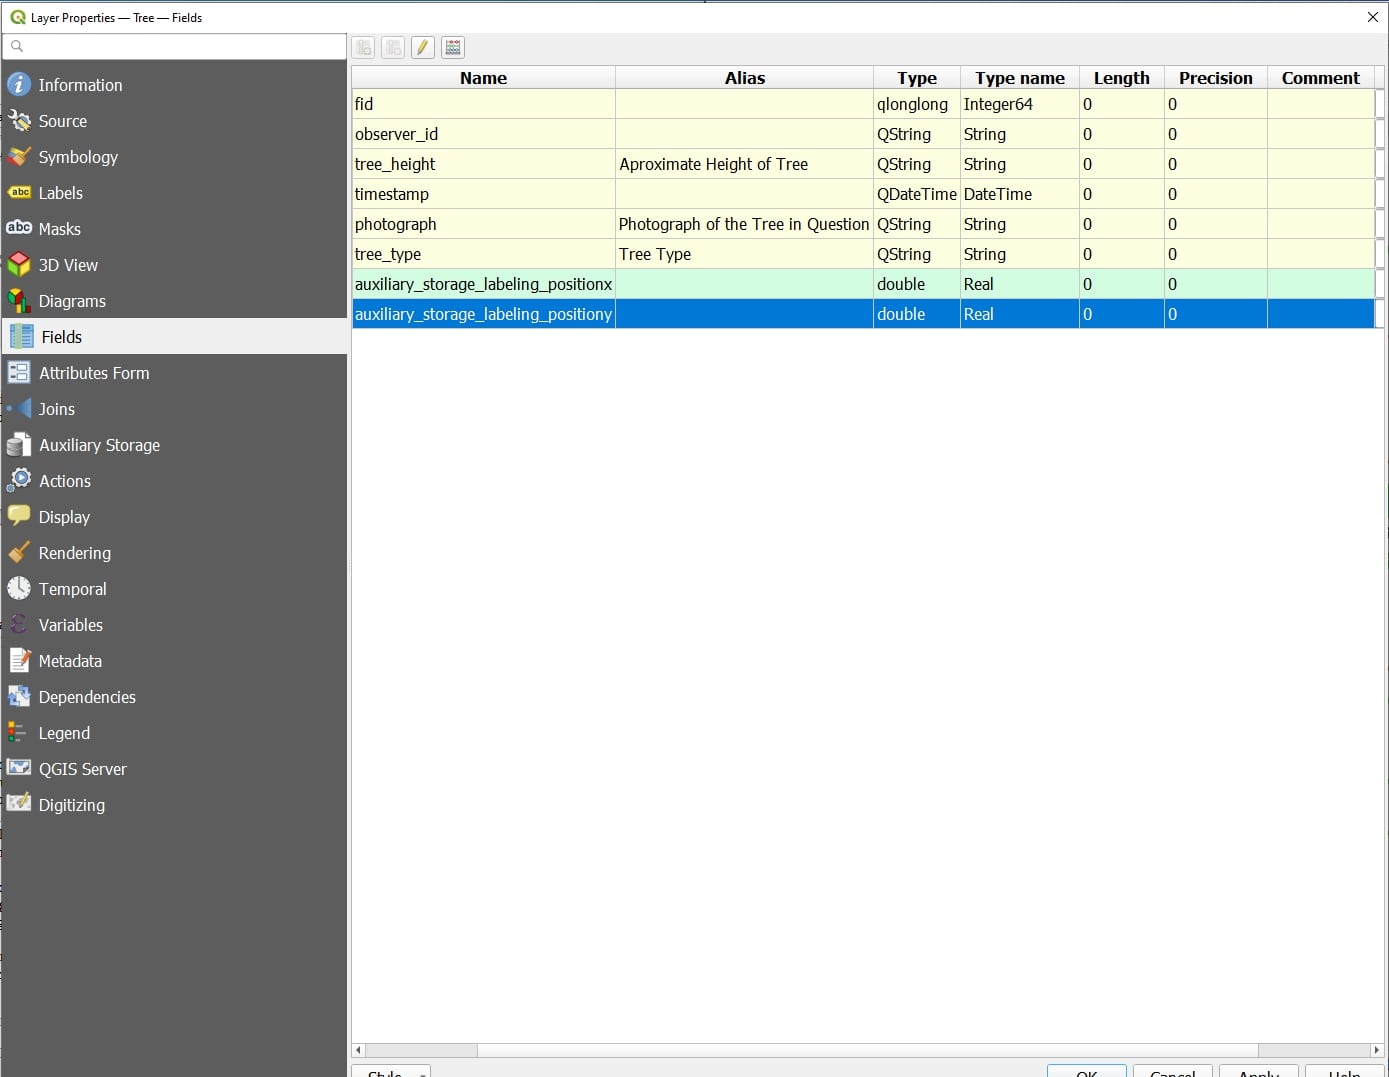
Figure 4: Attribute fields created for the layer in which data is collected.
Forms are created in the Attributes Form tab of the layer properties with the Drag and Drop Designer (Fig.5). In the Available Widgets column, click on each attribute field and define their defaults. For example under Observer ID, inputting @mergin_username into the default value field will result in the data collectors Mergin user name being shown. Similarly, an automatic timestamp for data collection can be achieved by placing $now into the defaults value field. Choose what data needs to be collected in the "Form Layout" from the Available widgets column (Fig.5). Any widgets not chosen will be hidden in the final form. Go through the range of the boxes (Widget display, General widget type, etc.) and assign appropriate values (e.g., Fig.5). Under widget display, check the box for the label, and under General assign a descriptive alias for the data. Under Widget Type, value maps are helpful when the data collector needs to pick from a list of predetermined items like tree heights. The value map needs to be input manually by the project creator. If the data collector needs to fill in a text field, then the "text edit" is appropriate. The Widget types are generally intuitive to use and assign. Further, when clicked on, the Widgets have a description to help the creator understand what they do. Under the constraints, one can specify if data is required to be not null (no value entered) to save the form. The best way to get to know how to make forms is to go through and experiment with each field and see what they do. Forms can be checked QGIS by toggle editing the layer and adding some geometry. Once a point is added, for example, QGIS will open a dialog box requiring the input of field attributes, giving a preview of the form and what the data collector will see in the Input (Fig.6).
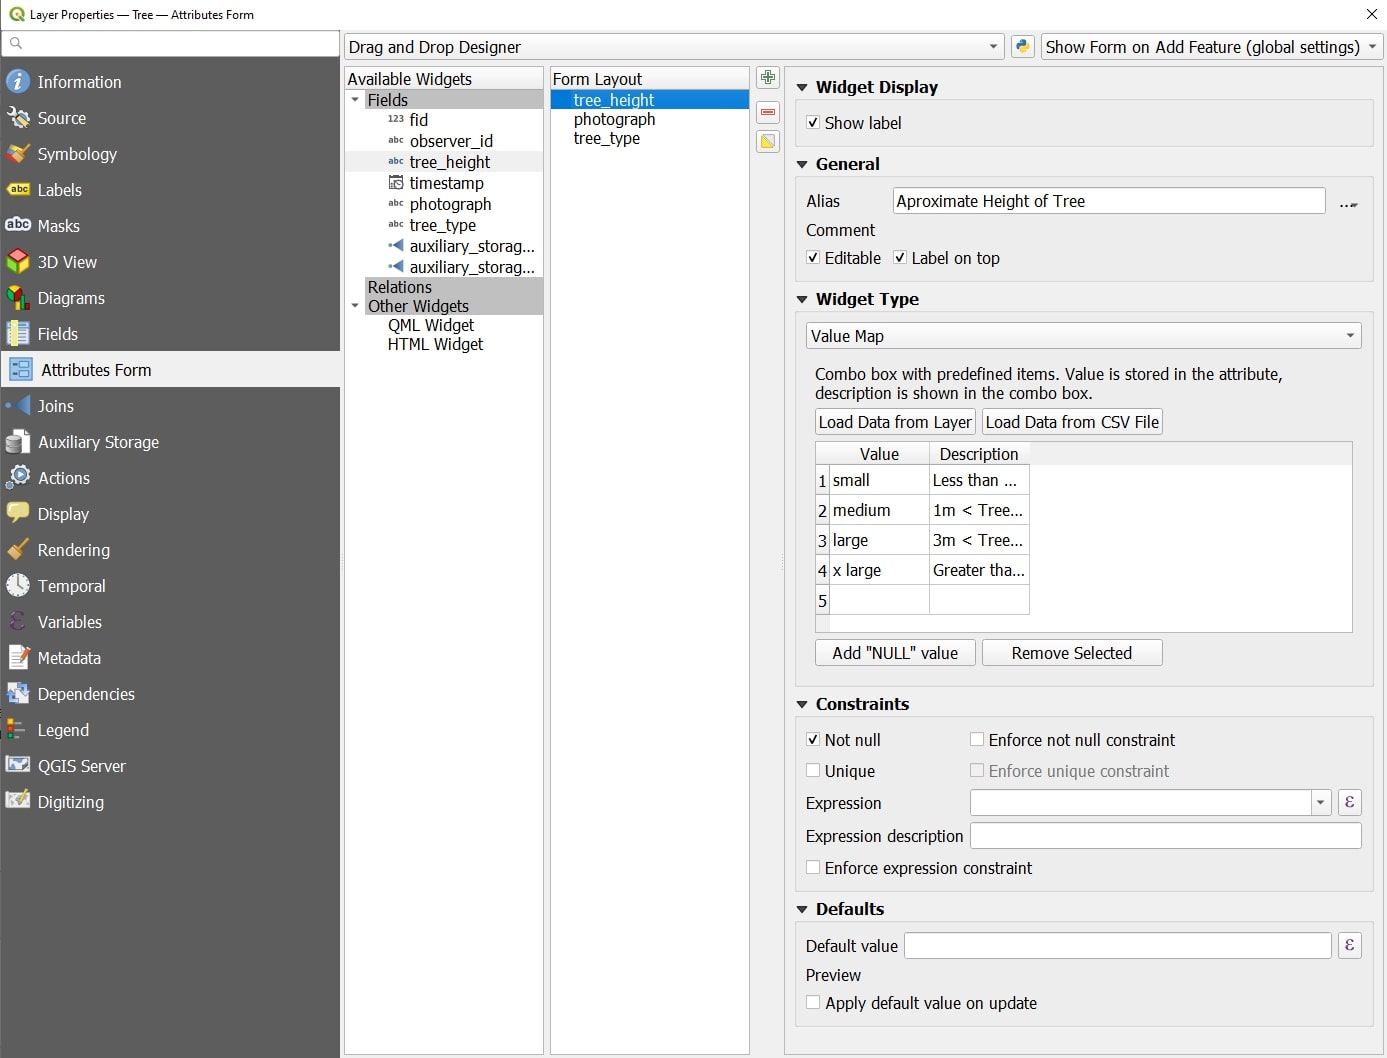
Figure 5: Form creation in the Attributes From tab of the layer properties with an example of tree information using a value map.
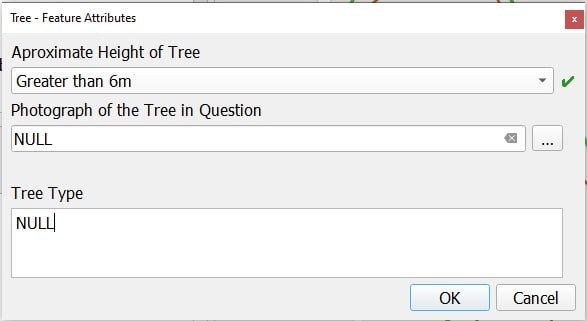
Figure 6: the attributes form shown in QGIS when digitising.
To finish the project in QGIS, the layers need to be organised and assigned into map themes for online and offline use. Firstly, make sure the base maps are at the bottom of the list of layers and that the layers make cartographic sense. The points should be above the lines and lines above polygons. The base maps should be assigned to different themes, including an offline theme if MBTiles were made. This can be done by checking and un-checking the base map layers, assigning each to its own theme, and saving the project with the themes. Finally, the project needs to be uploaded to Mergin. The Mergin plugin can be found in the browser tab (Fig.7), and once configured using the user's login credentials, a project can be added. Right-click on Mergin select create a new project. Follow the prompts and make sure to select the current project folder in the dialogue box. The Mergin plugin will automatically synchronise the project folder up to the Mergin cloud. The project will be available under the My protects tab (Fig.7) and can be found on the web-based Mergin page.
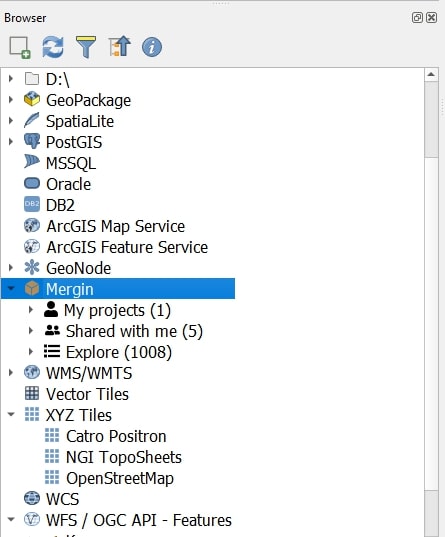
Figure 7: Mergin expanded in the browser panel of QGIS.
Once the project is stored in Mergin, it can be accessed and synchronised using Input. Input can be downloaded from the app store of a phone or tablet (Fig.8.A). Once opened for the first time, Input will prompt the user to sign in with their Mergin credentials. Then the projects can be accessed under the projects tab (Fig.8.B). Projects can be accessed by downloading them onto the portable device using the download button. The home page of Projects is where the projects can be synchronised from and to Mergin when the device is online (Fig.8.B). Synchronisation should happen any time that changes are made to the project in QGIS so that the changes can be seen in Input or after data has been collected in Input to update the desktop QGIS project. Once the project is downloaded, clicking on the project will open it and take the user to the main page. The app navigation is intuitive. To explore the project, it is best to start by going through the More tab. Under More the is browse features that shows the project layers, the map themes where base maps can be changed, and the settings for the data collection (Fig.8.C). On the main page, there are tabs for recording data and centreing the GPS (Input uses the inbuilt GPS unless another device is connected to the phone or tablet) (Fig.8.C).
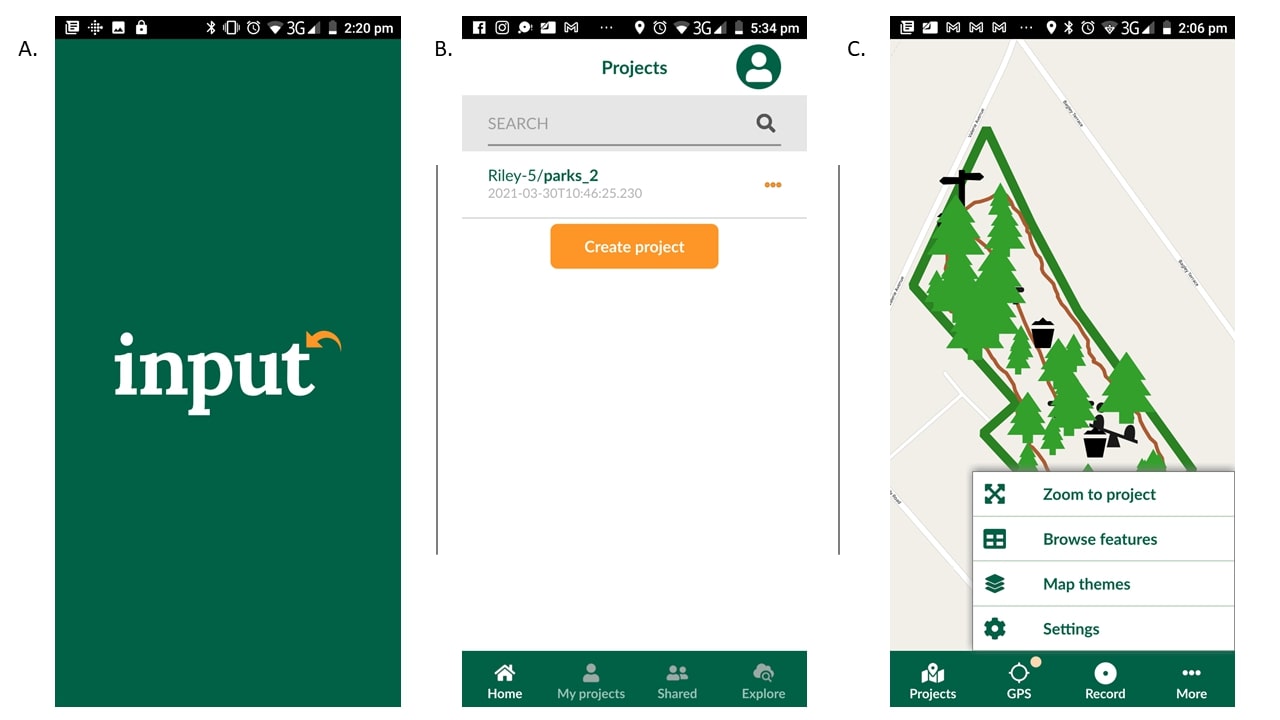
Figure 8: A. the mobile Input application, B) the home page of the Projects tab where projects can be viewed and synchronised, C) the More menu open with the options.
Before starting data collection explore the settings menu. Settings is where the GPS accuracy can be set, the user can find the help menu and the terms of service are found (Fig.9.A). Once the settings are set, it is time to record data. Simply navigate to the record button (Fig.8.C) and select the desired layer by clicking on the light green ribbon above the data collection tools. A menu to choose from will appear (Fig.9.B). The use of the geometry collection tools may take some practice. Make sure to wait for the pointer to turn green, showing ideal GPS accuracy if it does not turn green, make sure you can see the sky and your device's GPS is activated. Once a point, line, or polygon is recorded, the data collection form will open where text, data, and media like photos and videos can be added (Fig.9.C). Collected can be edited in Input. Once finished data collecting synchronise the project to Mergin so that it will be available in the QGIS desktop project. Once the data is synchronised into the QGIS project, it can be further manipulated, symbolised, and map layouts and reports created.
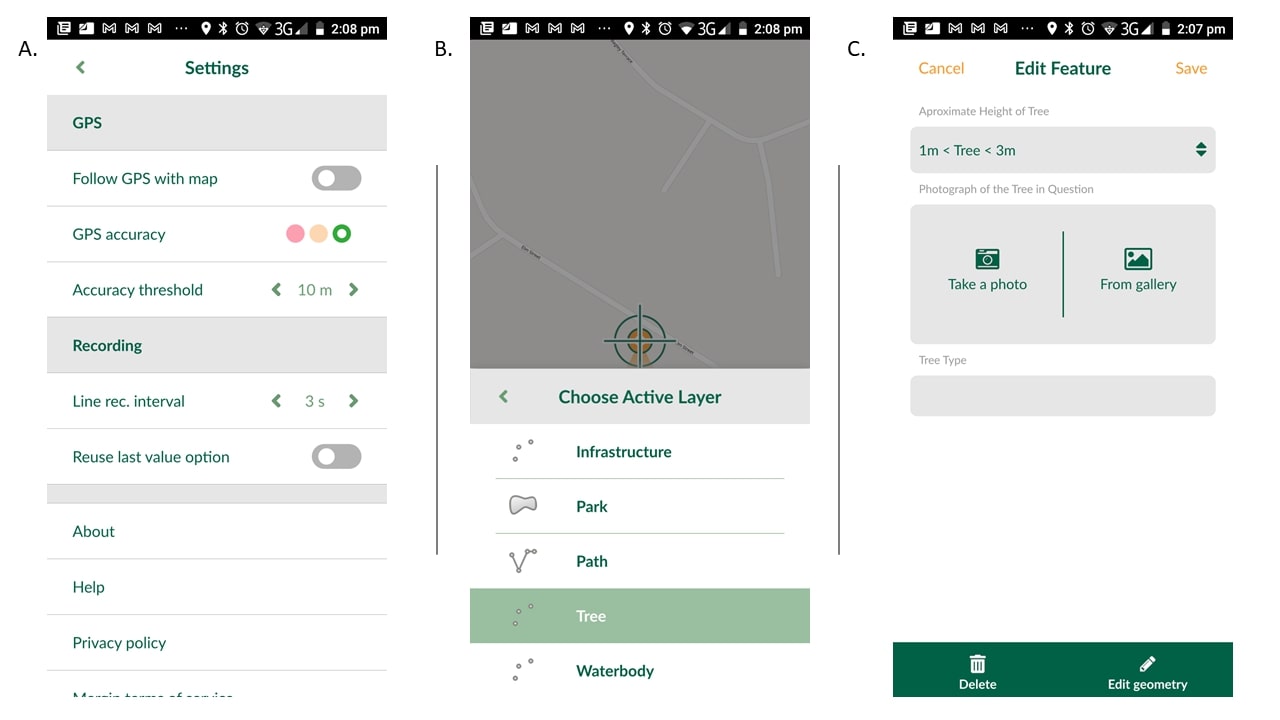
Figure 9: A) the settings menu, B) the layers created in the parks projects in the record tab in Input, C) the form associated with required tree data.
The interns' parks project is a simple way to get to know and explore the Input system. However, this type of field data collection system has endless applications and uses. Any data that is collected with a location or geographical aspect can be collected using the Input workflow. This field data collection method can be applied to record land parcels in land tenure projects or to collect point coordinates and other information associated with alien plants in invasion biology studies. The input system can be used by multiple data collectors making it ideal for large multi-user projects. If the Intern team can do it, so can you, so pick up your phone, go outside and start collecting data.
Amy Ternent
Amy is a Graduate Environmental scientist. She has an Honours degree from the University of Pretoria and a Masters in Environmental Science from The University of the Witwatersrand. She Works at Kartoza as a Junior GIS specialist and GIS Technician. Amy is passionate about the environment and using GIS to solve complex ecological and environmental issues. She is also creative and enjoys nothing more then making beautiful and functional maps using open source technology. She also enjoys creating and editing videos and other multimedia projects for education and inspiration. She loves creating social media content and interacting with the vibrant QGIS and open source community through Open days and other initiatives.In her spare time Amy can be found hiking, camping, birding or on almost any outdoor adventure. When she is not hiking up a mountain, she enjoys slowing down with a number of creative pursuits, including drawing, embroidery, and laser engraving / cutting her latest designs.


No comments yet. Login to start a new discussion Start a new discussion